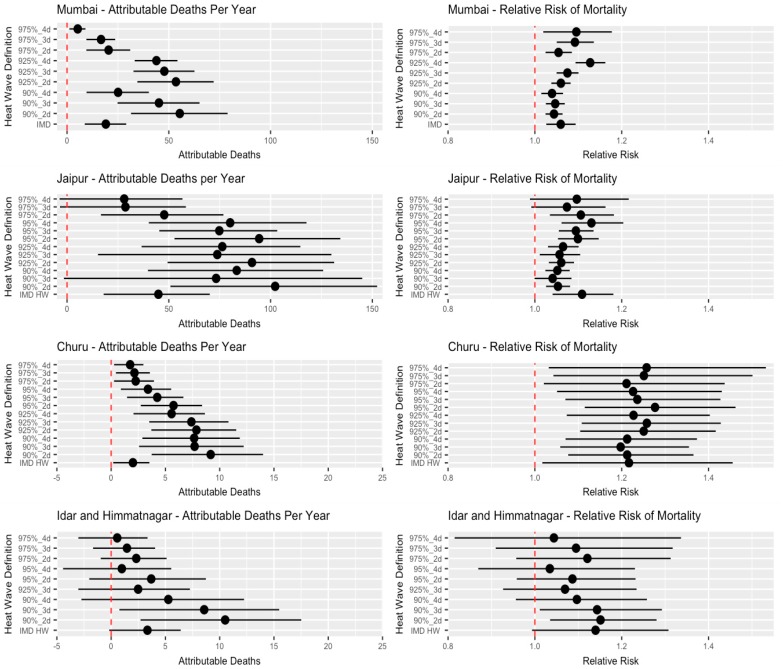
Figure 1.
Annual average heat wave attributable deaths* and relative risk of mortality during a heat wave**, for all communities, by heat wave definitions (Where distinct heat wave periods occur). * Over whole study period for that community; see Table 1. ** A comparison of HW days to matched non-HW days. Note—Scale for attributable deaths is different by community.

