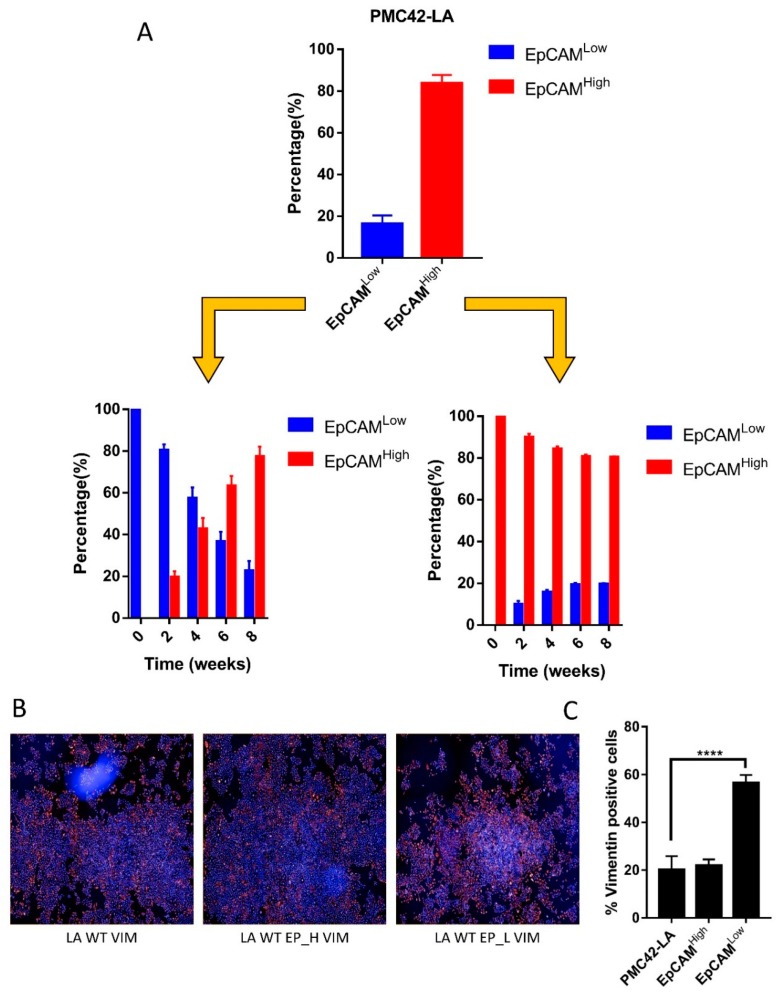
Figure 2.
(A) Bar charts showing the proportion of cells in EpCAMlow and EpCAMhigh state as intermittently assessed by FACS every two weeks from in vitro culture of FACS isolated EpCAM low and high subpopulations. Data analyzed using repeated measures ANOVA for temporal dynamics signify P = 0.0001 for EpCAM high transitions and P < 0.0001 for EpCAM Low transitions. (B) Immunofluorescence images captured on Operetta high-content imaging system and clustering of nine images at 10× resolution from the center of the well for vimentin expression. (C) Bar graph quantifying the number of cells positive for Vimentin expression across PMC42-LA parental and EpCAM sorted subpopulations using Operetta Harmony software. Significant differences were calculated using a paired t-test, **** P < 0.0001.

