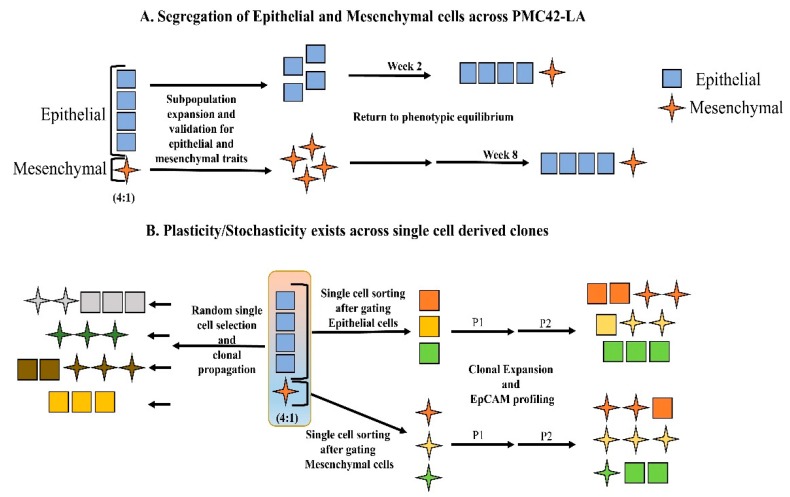
Figure 3.
(A) Schematic depicting the results of phenotypic equilibrium achieved across sorted and passaged EpCAM subpopulations. (B) FACS based single cell sorting and clonal propagation to examine the proportion of epithelial and mesenchymal cells using EpCAM profiling. Single cells were randomly selected across the whole cell population, as well as after gating for epithelial and mesenchymal selection, and seeded in 96-well plates. The progeny of the cells were EpCAM profiled after Passage 2 to identify variation across phenotypic plasticity.

