Figure 5.
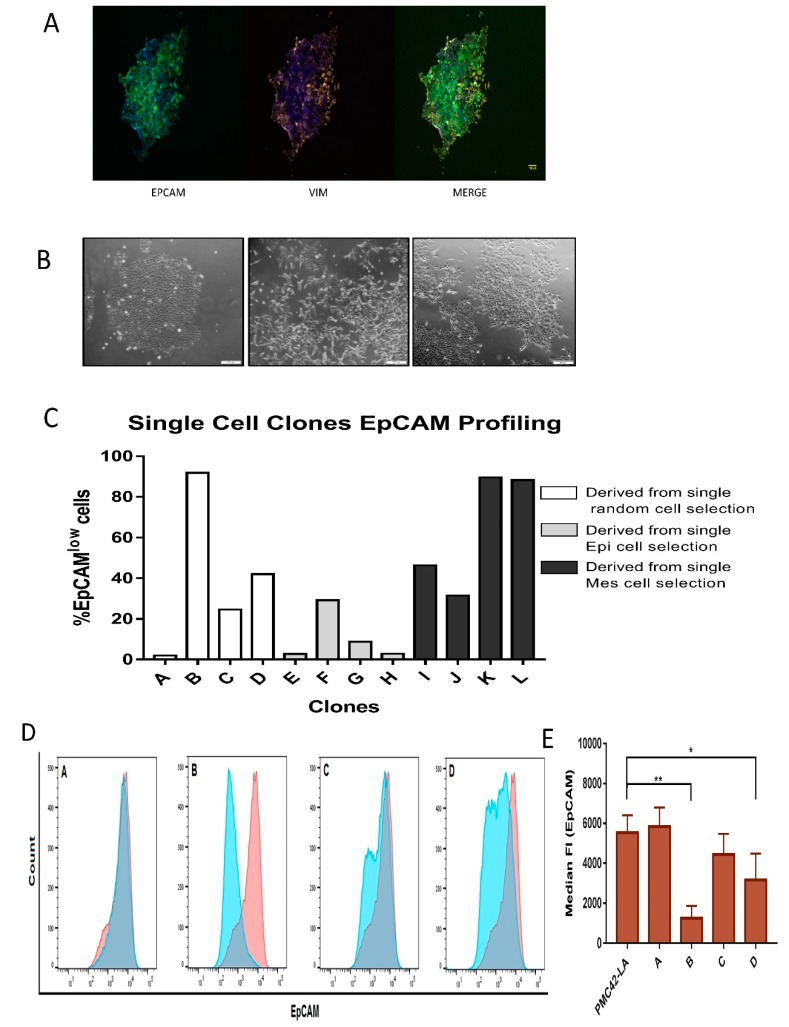
(A) EpCAM expression on the cellular junctions and concomitant vimentin-positive cells growing out from an individual cell derived clone (pictures were taken after three weeks of single- cell clonal propagation). (B) Morphological assessment of epithelial clustered colony, mesenchymal segregated cells, and mixed epithelial and elongated colonies obtained from clonal propagation of single cells after gating for EpCAMlow and EpCAMhigh cells after the first passage. Scale bar, 200 µM. (C) FACS profiling for EpCAM results in distribution of EpCAM low and high cells at variable ratios across various single cell-derived clones. (D) Histograms depicting the proportion of EpCAM high and EpCAM low cells in the four selected clones as overlap with parental EpCAM profile (red). (E) Staining intensity of EpCAM for the clones and parental PMC42-LA cells assessed by median fluorescence intensity unit (n = 4). Significant differences were calculated by one-way ANOVA and nonparametric Dunnett’s multiple comparisons test. * P < 0.05, ** P < 0.01.

