Figure 6.
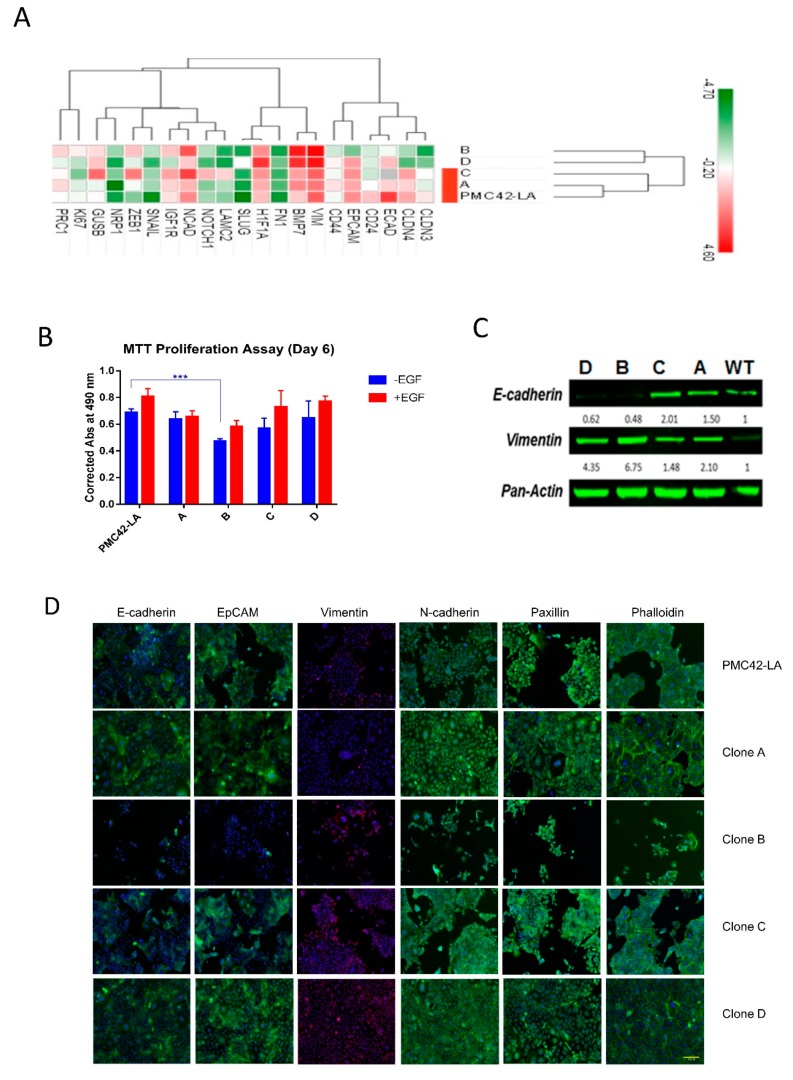
(A) Hierarchical clustering of the ΔCt values for the transcriptome data with epithelial-mesenchymal transition (EMT) marker genes for the four clones and PMC42-LA cell line. (B) Proliferation rate assessment for the selected clones and parental PMC42-LA with and without epidermal growth factor (EGF) stimulation (n = 3). Significant differences were calculated by two-way ANOVA and Sidak’s multiple comparisons test. *** P < 0.001 (C) The expression of E-cadherin and vimentin as determined by immunoblotting for the clones and parental PMC42-LA cells. Pan Actin was used as the loading control. (D) Immunofluorescence microscopy analysis of changes in the localization and expression levels of EMT influencing marker proteins. Selected clones and parental PMC42-LA subline were stained with antibodies against the epithelial markers E-cadherin and EpCAM, against the mesenchymal marker Vimentin and N-cadherin, against paxillin to detect focal adhesion plaques, and with phalloidin to visualize the actin cytoskeleton. Scale bar, 100 μm.

