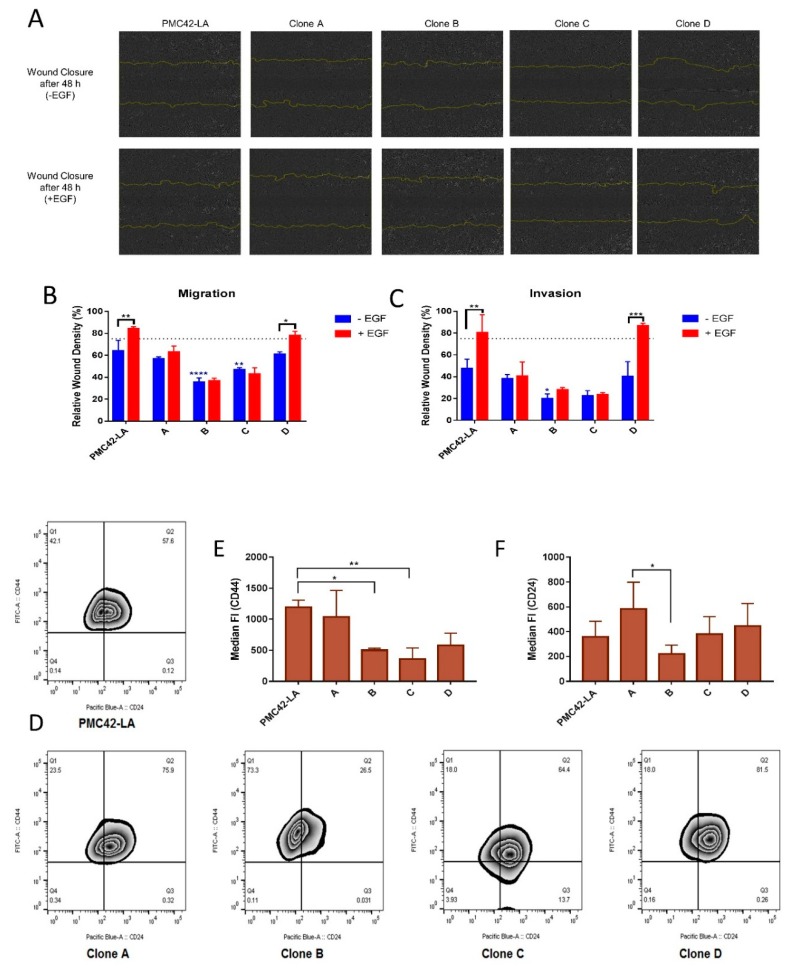
Figure 7.
(A) In vitro migration capacity of PMC42-LA cells and clone cell lines. The capacity to migrate with and without EGF treatment was measured by live cell imaging in a scratch wound healing assay (IncuCyte ZOOM). Microscope images of migrated PMC42-LA cells and clones are shown after 48 h. Yellow lines denote the original scratch wound. The variation in the density of wound closure with and without EGF treatment is clearly depicted across clones. (B) Percentage of relative wound density obtained from IncuCyte™ Scratch Wound Cell Migration. (C) Invasion assay after 48 h represented as bar graph. Data are presented as the mean ± std dev of three independent experiments. Significant differences were calculated by two-way ANOVA and Sidak’s multiple comparisons test. * P < 0.05, ** P < 0.01, *** P < 0.001, **** P < 0.0001 (D) Zebra plot showing the flow cytometry surface staining of CD44 and CD24 expression markers on parental and clonal progenies of PMC42-LA. (E) Staining intensity of CD44 assessed by median fluorescence intensity unit (n = 4). (F) Staining intensity of CD24 assessed by median fluorescence intensity unit (n = 4). Significant differences were calculated by one-way ANOVA and nonparametric Dunnett’s multiple comparisons test. * P < 0.05, ** P < 0.01.

