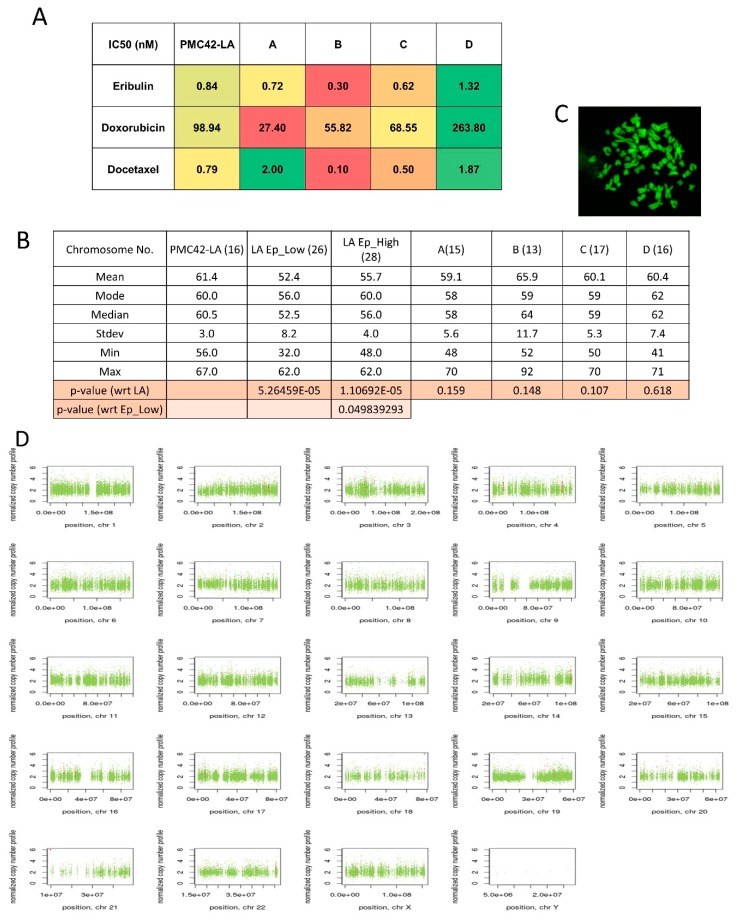
Figure 8.
(A) Plot of heatmap on the basis of computed IC50 values of the drugs eribulin, doxorubicin, and docetaxel for PMC42-LA and the four selected clones. (B) Measurements of central tendency from distribution of chromosome number across PMC42 LA, EpCAM sorted subpopulations and four clones. Student t-test was applied to calculate p-value. (C) Metaphase spreads of PMC42-LA chromosomes stained with DAPI and imaged with confocal microscopy. (D) Visualization of Control-FREEC v6.0 output from PMC42-LA sorted EpCAM subpopulations whole exome sequencing data (Illumina HiSeq 2000). Copy number profiles for all chromosomes are shown for EpCAMlow subpopulation in comparison to EpCAMhigh; normal copy number status is shown in green, copy number gains are represented in red, and copy number losses are represented in blue.

