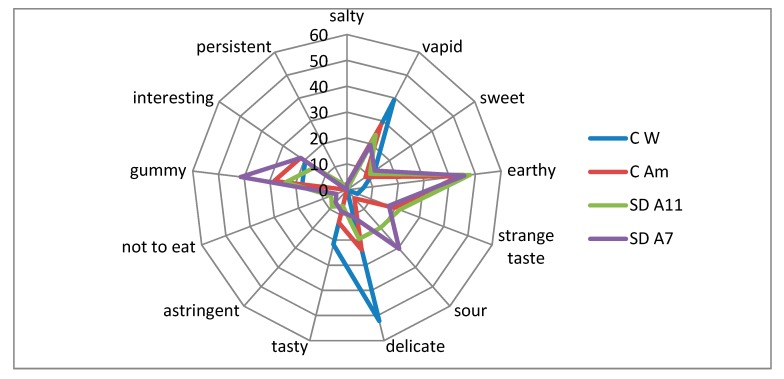
Figure 5.
Spider plot of the sensory evaluation (%) of breads. Blue line: % of positive answers given to wheat control bread (C W); red line: % of positive answers given to amaranth control bread (C Am); green line: % of positive answers given to L. farciminis A11 sourdough bread (SD-A11); purple line: % of positive answers given to L. brevis A7 sourdough bread (SD-A7).

