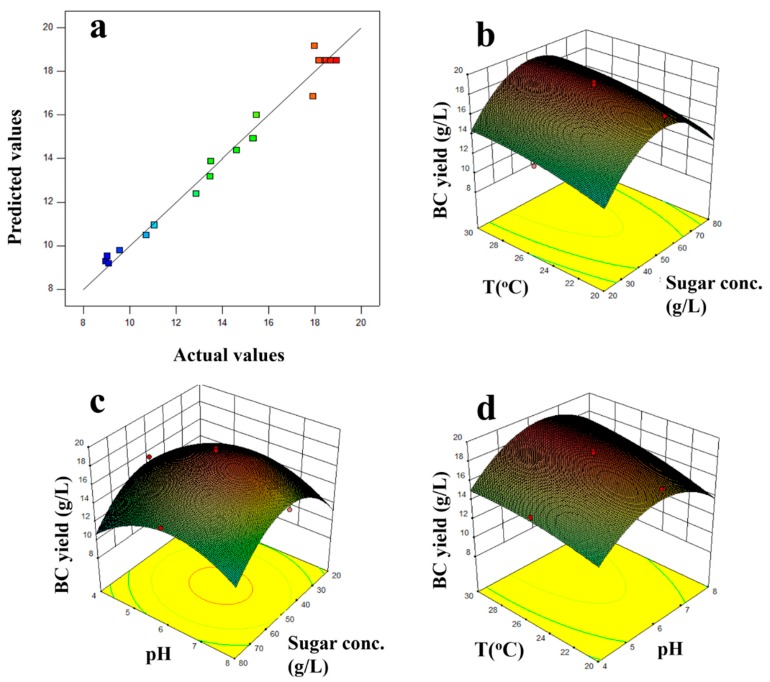
Figure 1.
(a) Predicted values against experimental data of bacterial cellulose (BC) yield (g/L) according to the experimental design, and three-dimensional (3D)-imaging of the BC yield response surface at (b) varying pH levels and sugar concentration (Sugar conc.), (c) varying sugar concentration and temperature (T), and (d) varying pH levels and temperature (Experiment 1).

