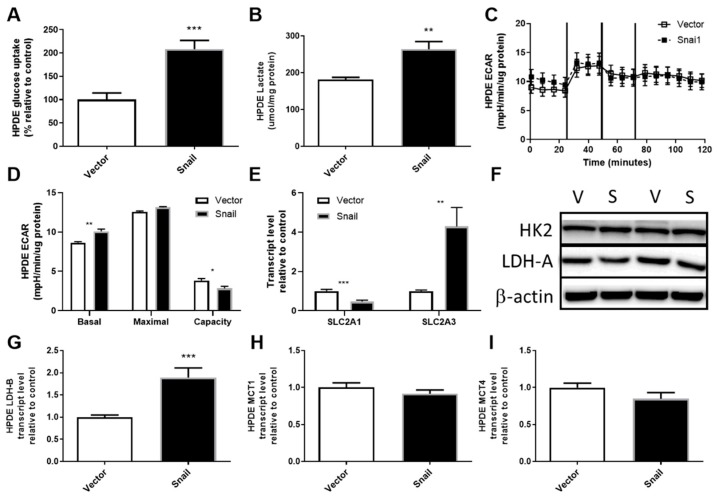
Figure 4.
Effects of Snail overexpression on glucose uptake and lactate production in HPDE cells. (A) Rate of glucose uptake measured by 3H-2-Deoxy-Glucose tracer over an 8 min period. (B) Lactate assay performed on cell culture media collected after 72 hours of culturing. (C) Extracellular acidification rate (ECAR) measured using the Seahorse XF96 Analyzer at basal levels for 30 min followed by sequential injections of 1 μM oligomycin, 0.5 μM Carbonyl cyanide-4-(trifluoromethoxy)-phenylhydrazone (FCCP) and 1 μM rotenone at 30 min intervals. (D) basal and maximal glycolytic activity and glycolytic capacity calculated from Seahorse data. (E) Fold-change in total RNA for SLC2A1 (encoding Glut1) and SLC2A3 (encoding Glut3) measured by qPCR using β-actin as housekeeper. (F) Immunoblotting results for hexokinase II (HK2) and lactate dehydrogenase A (LDH-A) with β-actin as loading control. (G–I) Fold change in total RNA detected for lactate dehydrogenase-B (LDH-B) and monocarboxylate transporter 1 (MCT1) and 4 (MCT4). Results are shown as mean ± SEM with n = 3. ** p < 0.01, *** p < 0.001 for difference between vector control and Snail-overexpressing cells.

