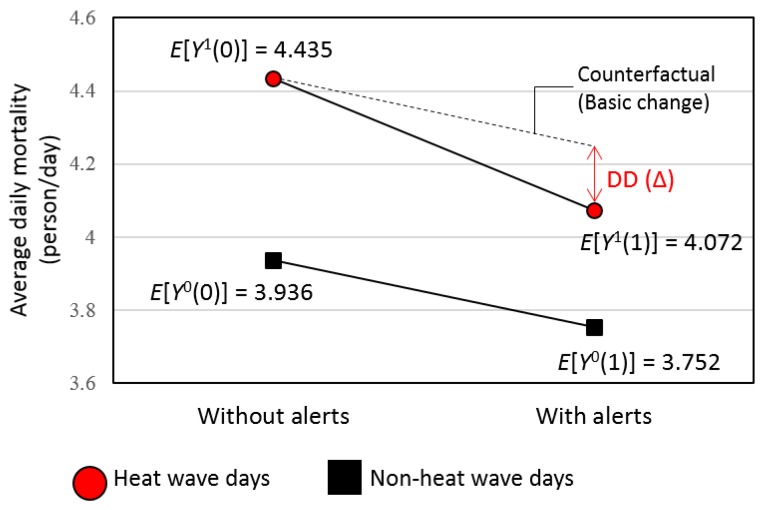
Figure 1.
Average all-cause mortality (person) per day for the heat wave categories (2009–2014). Notes. DD: difference in difference, : mortality in false positive heat wave days, : mortality in true heat wave days, : mortality in true non-heat wave days, : mortality in false negative heat wave days. The noted DD is the estimated effectiveness of the heat wave alerts adjusted for the counterfactual mortality difference for non-heat wave days (comparison group) with and without heat wave alerts.

