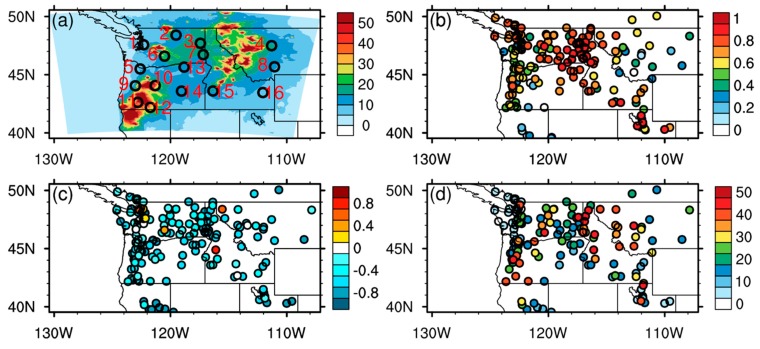
Figure 4.
Statistical evaluation results of the raw WRF-CMAQ SENS simulated PM2.5 surface concentrations during 8/15–9/14/2017: (a) monthly averaged PM2.5 surface concentrations (unit: μg m−3). The black circles and red numbers denote 16 selected ground sites for the time series evaluation in Figure 5; (b) temporal correlations (unitless) between the SENS simulation and AirNow observations at each ground site; (c) fractional biases (unit: 100%) based on the SENS simulation and AirNow observations; (d) RMSE (unit: μg m−3) based on the SENS simulation and AirNow observations. RMSE: root mean squared error.

