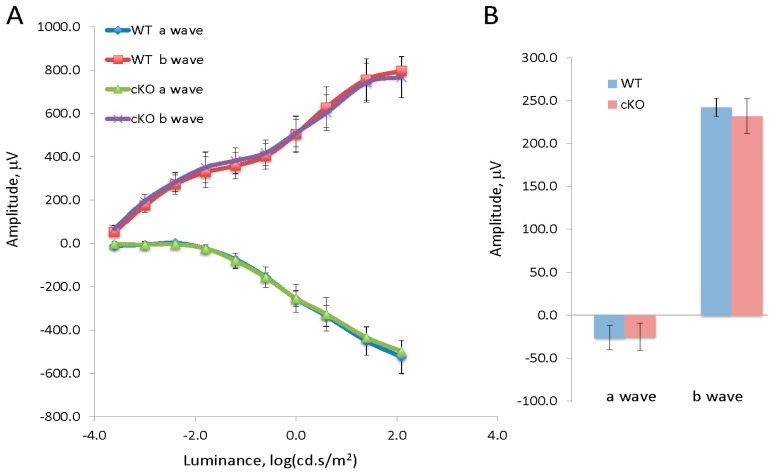
Figure 1.
(A) Graph of the a-wave and b-wave responses of a dark adapted ERG with 10-steps of increasing stimulus luminance for wild type (XBP1 fl/fl; WT) mice (n = 8) and XBP1 fl/fl; Chx10-cre positive (cKO) mice (n = 12); (B) Graph of the a-wave and b-wave responses of a transient, light-adapted ERG for WT (n = 6) and XBP1 fl/fl; Chx10-cre positive mice (n = 12). Data are expressed as mean ± S.D.

