Figure 3.
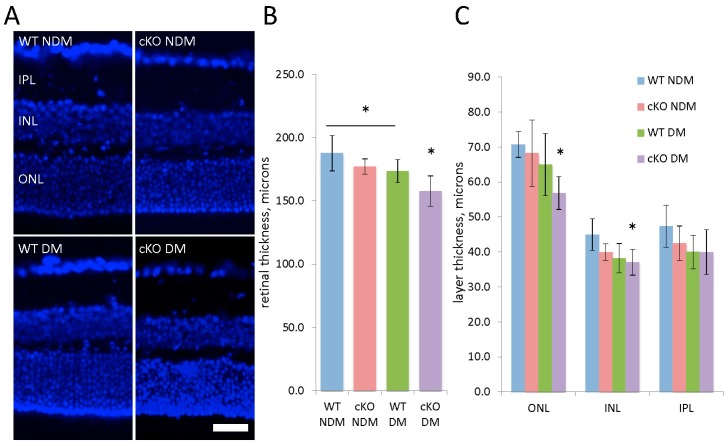
(A) Retinal cryosections (20 µm) stained with DAPI (blue) to label nuclei and identify retinal layers for wild type (WT) non-diabetic (NDM; n = 5) and 20-week diabetic (DM; n = 5) mice and XBP1 fl/fl; Chx10-cre positive (cKO) NDM (n = 5) and DM (n = 6). Scale bar = 40 µm; (B) Graph of total retinal thickness indicates the WT DM retina is significantly thinner than WT NDM retina and the cKO DM retina is thinner than all other groups; (C) Graph depicting the thickness of the outer nuclear layer (ONL), inner nuclear layer (INL), and inner plexiform layer (IPL) shows some retinal thinning across all layers with significant decreases in XBP1 cKO DM ONL and INL. Mean ± S.D.; * p < 0.05.

