
Figure 5.
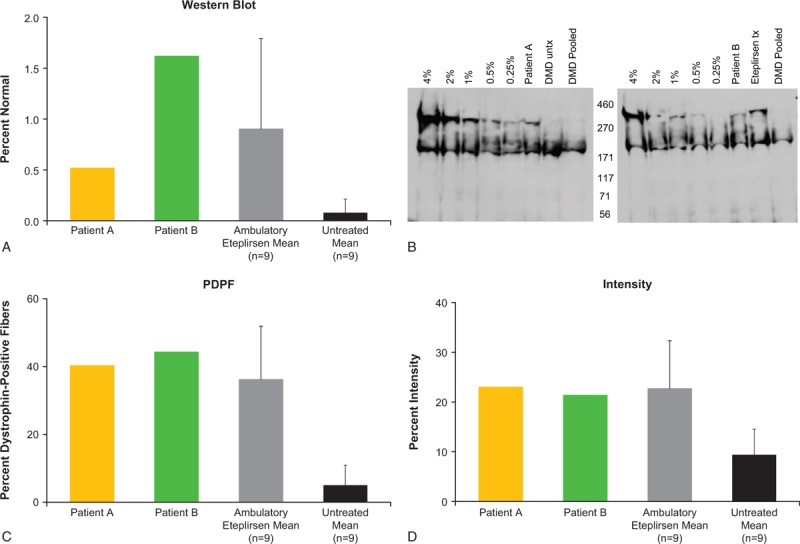
Dystrophin expression following 180 weeks of eteplirsen treatment, based on Western blot analysis and immunohistochemistry (A), Western blot image (B), PDPF (C), and the intensity of dystrophin fluorescent signal in muscle fibers (D). In panels A, C, and D, standard deviations are represented by error bars. In panel B, lanes in the Western blot image are identified left to right as the standard curve (4%, 2%, 1%, 0.5%, 0.25% of normal), patient samples (treated or untreated in blinded random order in next two lanes), and negative pooled DMD control sample. Patient samples representing patient A and patient B are identified in both figures. Note that either an unrelated patient sample representing an untreated (left figure) or treated (right figure) patient was run on the adjacent lane due to the random blinded nature that samples were evaluated. DMD = Duchenne muscular dystrophy, PDPF = percent dystrophin-positive fibers, tx = treated, untx = untreated.