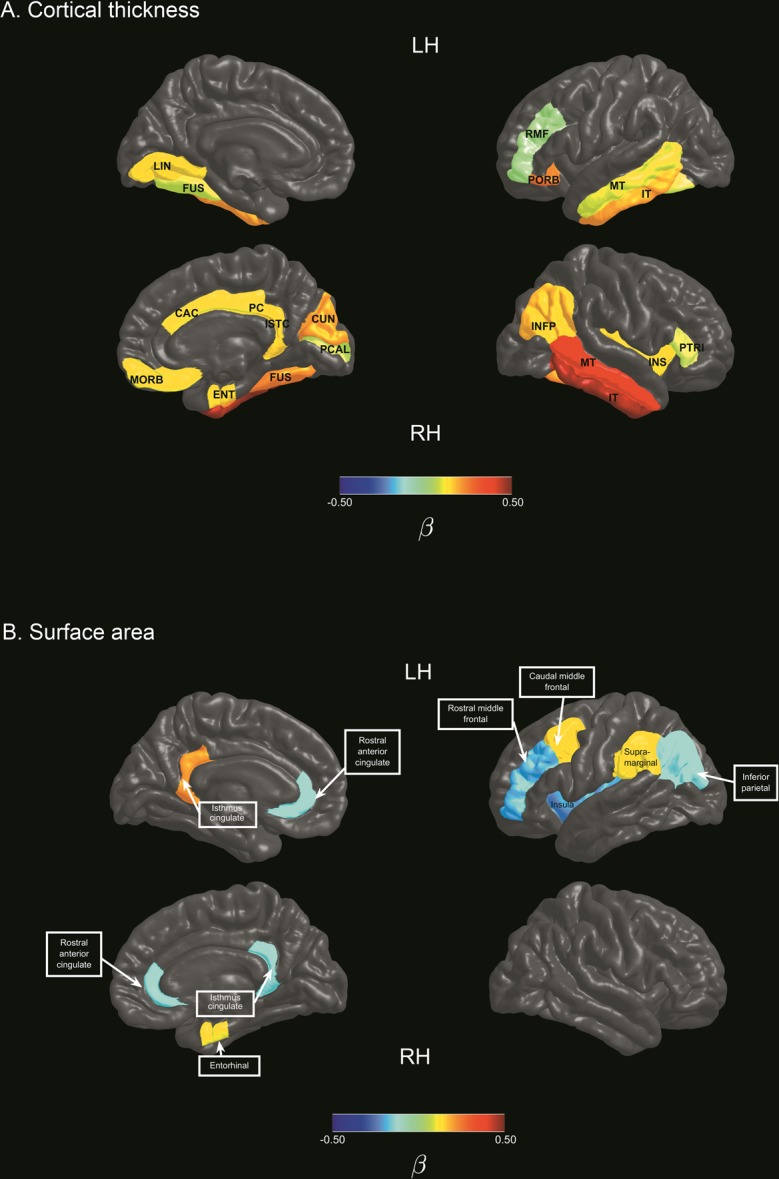
Figure 2.

Cortical features selected using regularised regression models. Colour bars represent mean beta coefficients of cortical regions associated with individual differences in symptom severity in ASD. (A) Cortical thickness features associated with symptom severity variation in ASD. (B) Surface area features associated with symptom severity variation in ASD. Note. CAC: caudal anterior cingulate gyrus; CUN: cuneus; ENT: entorhinal; FUS: fusiform gyrus; INFP: inferior parietal gyrus; INS: insula; ISTC: isthmus cingulate gyrus; IT: inferior temporal gyrus; LH: left hemisphere; LIN: lingual gyrus; MORB: medial orbitofrontal; MT: middle temporal gyrus; PCAL: pericalcarine; PC: posterior cingulate gyrus; PORS: pars orbitalis; RH: Right hemisphere; PTRI: pars triangularis; RMF: rostral middle frontal gyrus.
