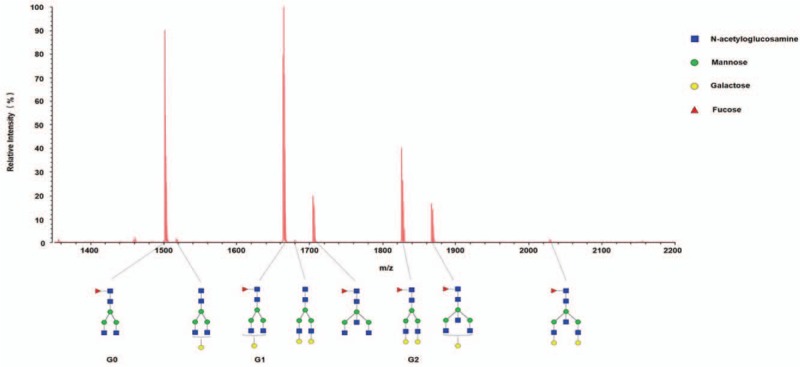
Figure 1.

Representative MALDI-QIT-TOF MS spectrum of serum IgG N-glycan profiles from CHB patients. In the mass spectrum, the x-axis (m/z) and the y-axis (relative intensity) represent mass-to-charge ratio and relative signal intensity of the IgG N-glycans, respectively. The annotation of peaks on mass spectrum was based on the relative molecular weight of IgG N-glycans. IgG N-glycans are comprised of N-acetylglucosamines, mannose, galactose, and fucose residues. Structure abbreviations: G0, G1, and G2 indicate fucosylated biantennary glycans with no galactose, 1 galactose, and 2 galactose, respectively.
