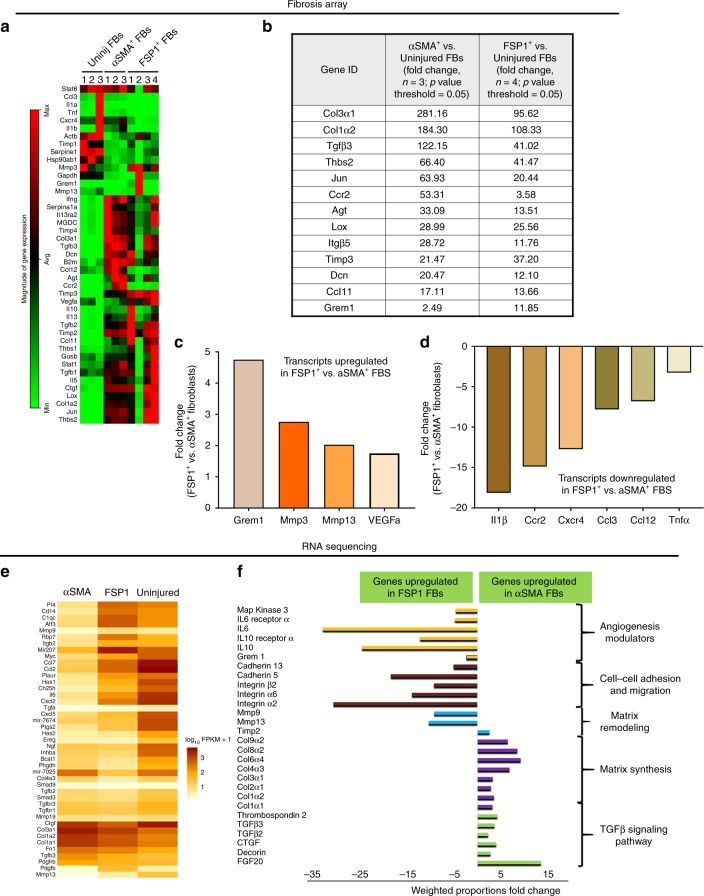
Fig. 5.
Distinct molecular signatures of uninjured, FSP1+, and αSMA+ fibroblasts identified by fibrosis array and RNA sequencing. a Heat map from fibrosis array representing magnitude of gene expression of genes expressed in freshly isolated uninjured, FSP1+, and αSMA+ fibroblasts (n = 3 for uninjured and αSMA+ fibroblasts, n = 4 for FSP1+ fibroblasts; cell isolation and FACS were performed at least three independent times. For each sorting, cells were isolated from pooled homogenates from three to four injured murine hearts 10 days post MI). FB = fibroblasts b Relative fold change of selected highest expressing genes identified by fibrosis array expressed by FSP1+ and αSMA+ fibroblasts compared with uninjured fibroblasts. c Relative fold change of upregulated genes expressed in FSP1+ fibroblasts compared with αSMA fibroblasts by fibrosis array. d Relative fold change of downregulated genes expressed by FSP1+ fibroblasts compared to αSMA+ fibroblasts by fibrosis array. e Hierarchical clustering (partial heat map representing log10 values) of RNA transcript reads per kilobase per million mapped reads for genes with significant differential expression (fold difference > 2, p value < 0.05) between uninjured, FSP1+, and αSMA+ fibroblasts using CLC Genomics Workbench 8.0. f Relative fold change of genes representing key pathways identified by RNA sequencing in αSMA+ vs. FSP1+ fibroblasts. Genes downregulated in αSMA+ fibroblasts are mentioned as genes upregulated in FSP1+ fibroblasts. KEGG pathway analysis was performed on the RNA sequencing data on DAVID bioinformatics Resource 6.7 platform

