Fig. 7.
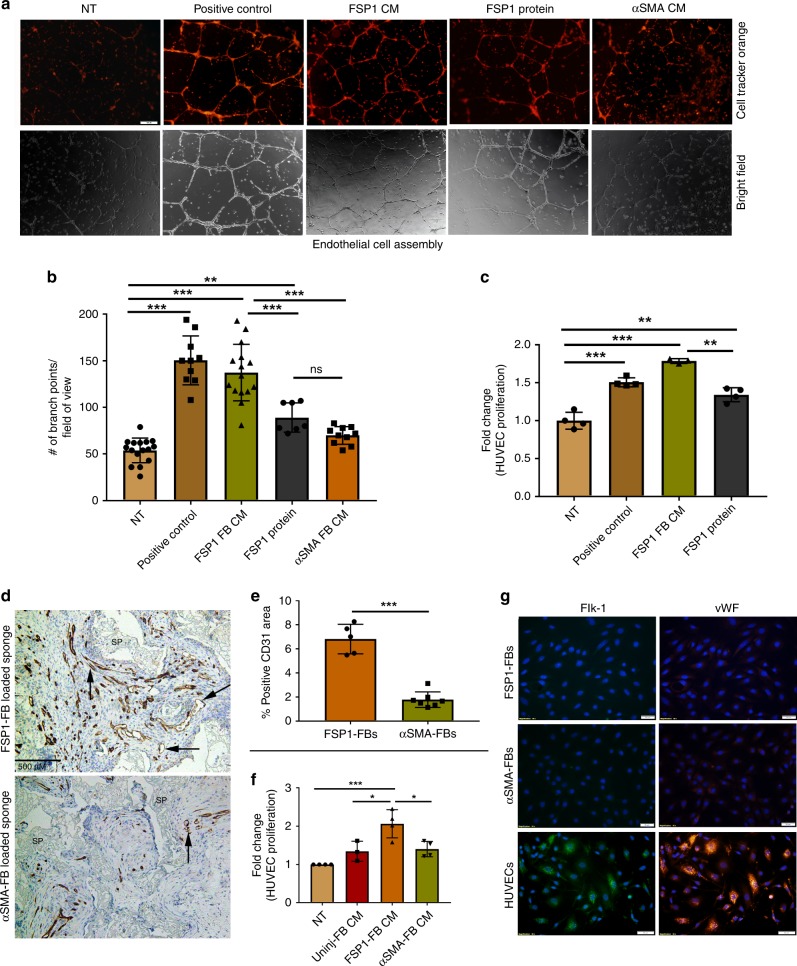
FSP1+ fibroblasts are pro-angiogenic in vitro and in vivo. a Representative images from an endothelial cell assembly assay using HUVECs treated with conditioned media (CM) collected from fibroblasts (P3–P5) or FSP1 recombinant protein. In the top row, the endothelial cells were stained with cell tracker orange and the second row contains corresponding bright field images (×20). Scale bar = 100 nM. b Quantification from the endothelial cell assembly assay based on the number of intersecting branch points per field of view (×10). Data represent an average of HUVEC cell assembly from n = 16 for NT, n = 10 for positive control, n = 15 for FSP1+ FB CM, n = 7 for FSP1 protein, and n = 10 for αSMA+ FB CM images from three independent biological replicates; bar represents mean ± SD. c BrdU proliferation assay performed on HUVECs (P5) in response to either FSP1+ fibroblasts conditioned media (with 0.2% serum; n = 3) or FSP1 recombinant protein (10 nM; n = 4). HUVECs cultured in full serum (2%; n = 4) were used as positive control. d Representative images of FSP1+ and αSMA+ fibroblast soak loaded sponges stained with CD31 to analyze vascular density. SP = sponge matrix, arrows point at positive stain. Scale bar = 500 µM. e Vascular density graphed as percentage of immunopositive CD31 area/total tissue area in histologic sections from granulation tissue. Data represent averages of multiple 40× fields from unpaired samples (n = 6 for αSMA+ fibroblast loaded sponges and n = 5 for FSP1+ fibroblast loaded sponges). f BrdU proliferation assay performed on HUVECs (P5) in response to NT (n = 4), FSP1+ (n = 4), αSMA+ (n = 4), and uninjured (n = 3) fibroblast (P3–P5) conditioned media. g Immunofluorescence staining of GFP+ FACS sorted fibroblasts (P3–P5) isolated from left ventricle of FSP1-GFP or αSMA-GFP mice indicate that FSP1+ and αSMA+ cell populations do not express endothelial markers such as vWF or Flk-1 (VEGFR2). HUVECs were used as positive control (n = 3). nsp > 0.05, *p < 0.05, **p < 0.001, and ***p < 0.0001 was calculated by one-way ANOVA, n = 3 experiments were performed; bar represents mean ± SD

