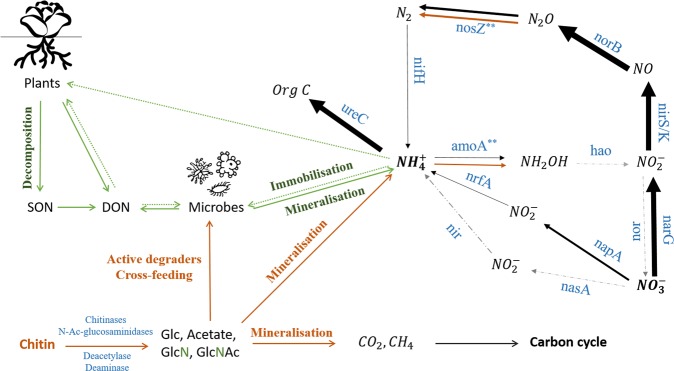
Figure 3.
Microbial N-cycle and chitin convergence and degradation pathway mediated through the addition of chitin. Enzymes involved in the N-cycle are indicated in blue. The metagenome reads are mapped towards these enzymes and the RPKG normalized counts representing the number of hits are illustrated by the arrow thickness in the figure. If there was a statistical effect of chitin addition, the enzyme is indicated with an asterisk (*), and a second arrow (orange) is drawn representing the normalized count of the genes related to the chitin-added samples. In addition, the chitin-degradation and its relation with the nitrogen cycle are illustrated in orange. Part of this figure was inspired on the paper of Levy-Booth et al.76,77.

