Fig. 2.
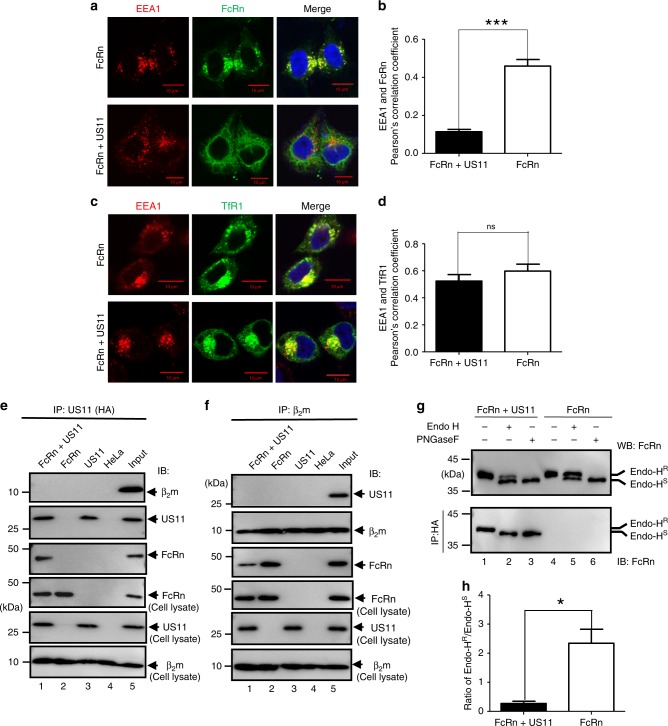
US11 expression retains FcRn in the endoplasmic reticulum (ER). a, c FcRn or CD71 appearance in the endosome in HeLaFcRn+US11 and HeLaFcRn cells. HeLaFcRn+US11 and HeLaFcRn cells were transfected with a plasmid expressing human CD71-GFP (green). Both cells were immunostained for FcRn (green) and EEA1 (red). b, d Averages of the EEA1 and FcRn or CD71 co-localization in HeLaFcRn+US11 and HeLaFcRn cells. Pearson’s correlation coefficient was measured in ten different optical regions (100 cells total) in each experiment. Error bars represented mean ± SEM of ten different optical regions. The nuclei were stained with DAPI (blue); co-localization of two molecules appears in yellow. Scale bar: 10 μm. Similar images were seen from at least three independent staining experiments. EEA1: early endosome antigen 1. ***P < 0.001, NS: no significance by Student’s t-test. e, f β2m or US11 does not co-immunoprecipitate with US11 or β2m protein. Cell lysates from HeLaFcRn+US11 (lane 1), HeLaFcRn (lane 2), HeLaUS11 (lane 3), and HeLa cells (lane 4) were immunoprecipitated by anti-HA mAb (e), anti-β2m Ab (f). All immunoprecipitates or cell lysates (20 μg) as internal controls were subject to western blotting with corresponding Abs as indicated. g, h Sensitivity of US11-associated FcRn HC to Endo-H digestion. g Native FcRn in cell lysates (top panel) or proteins immunoprecipitated by HA mAb (bottom panel) were digested by mock (lanes 1 and 4), Endo-H (lanes 2 and 5), or PNGase F (lanes 3 and 6) for 2 h at 37 °C, respectively. All immunoprecipitates or cell lysates (20 μg) were subject to western blotting with corresponding Abs as indicated. The ratio of Endo H-resistant (Endo-HR) FcRn HC to Endo H-sensitive (Endo-HS) FcRn HC from HeLaFcRn+US11 and HeLaFcRn cells were compared by the ratio of the band density of glycosylated FcRn to that of the deglycosylated FcRn (h). The band density of Endo-H-sensitive or resistant FcRn (g, top panel, lanes 2 and 5) was quantified by the software Image Lab 5.2. *P < 0.05 by Student’s t-test. Error bars represented mean ± SEM of three independent repeats. R: Resistant; S: Sensitive

