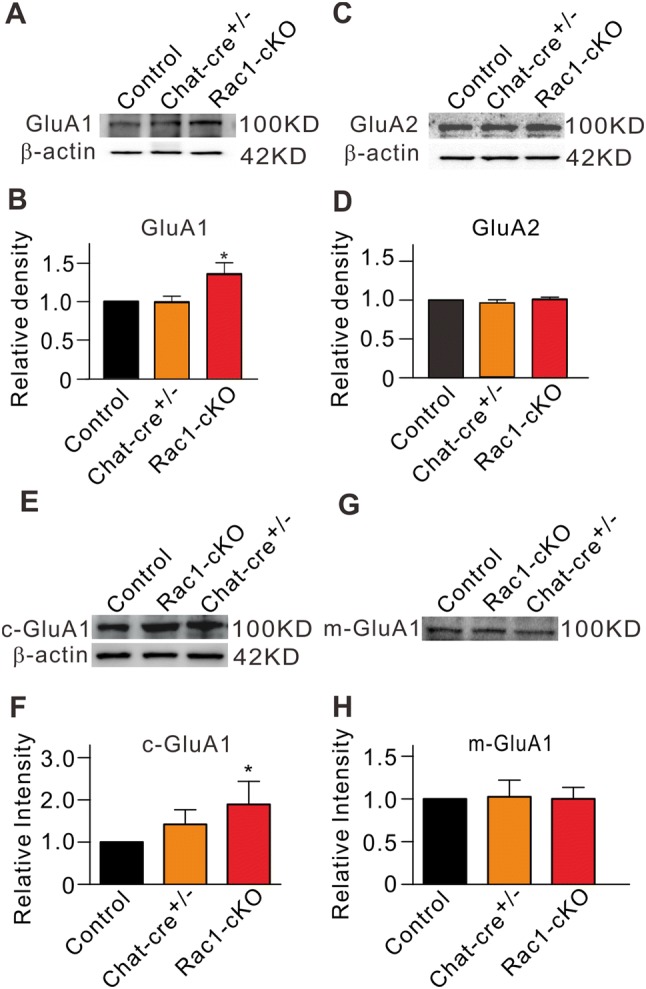
Fig. 3.

Protein levels of GluA1 and GluA2 subunits of AMPARs in retinal extracts from Rac1-cKO, Chat-cre+/–, and control mice. A, C Representative immunoblots of GluA1 (A) and GluA2 (C) protein levels. B, D Cumulative data showing the average densitometry of immunoreactive bands of GluA1 (B), GluA2 (D) expression. E, G Representative immunoblots showing the GluA1 protein levels of the cytoplasmic component (c-GluA1) (E) and membrane component (m-GluA1) (G). F, H Cumulative data showing the average densitometry of immunoreactive bands of c-GluA1 (F) and m-GluA1 (H) protein levels. All data are normalized to control. n = 6 for all groups. *P < 0.05 vs control.
