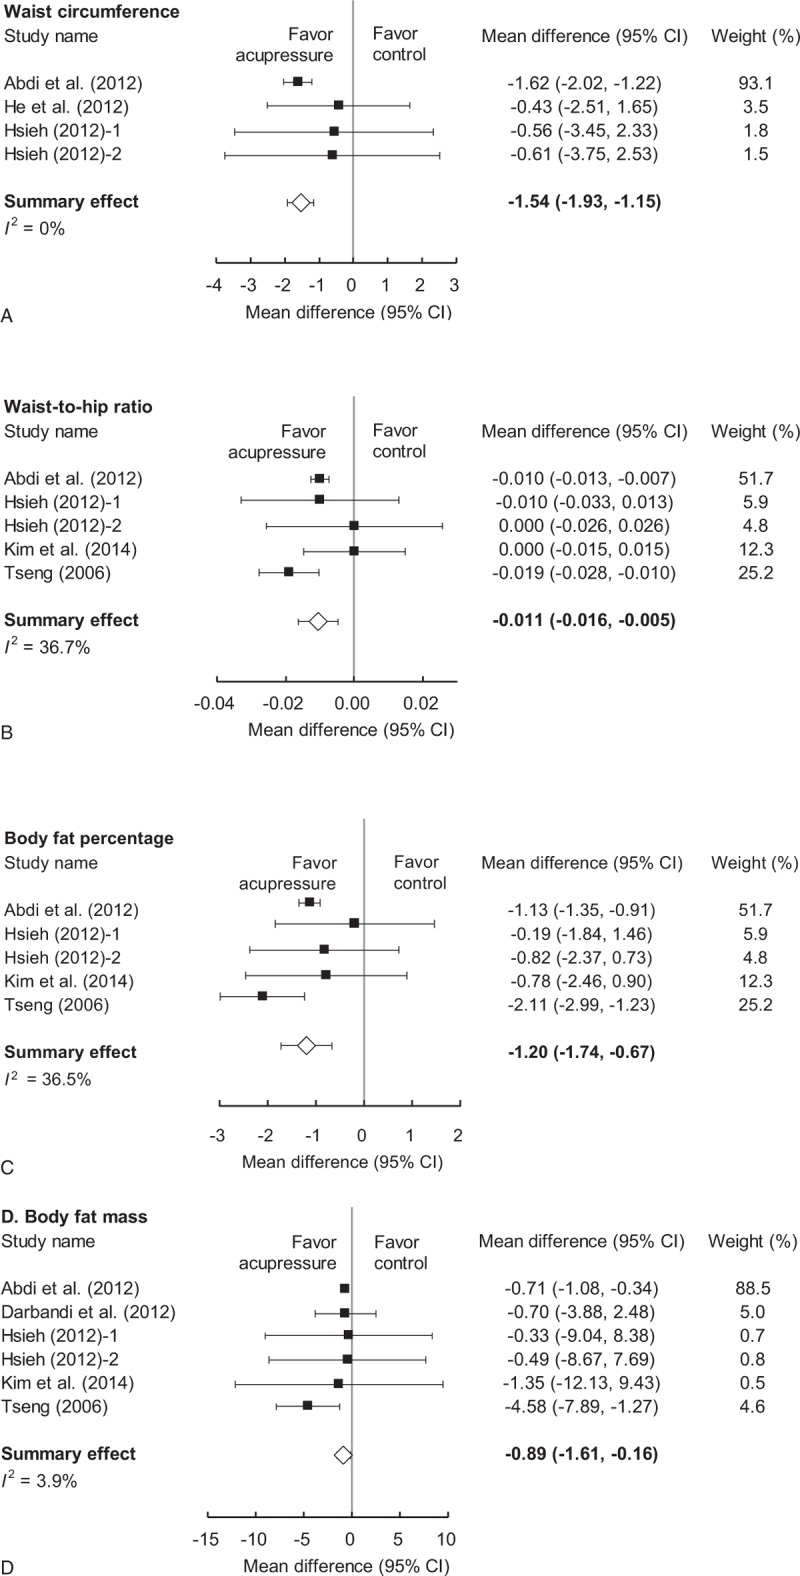
Figure 3.

The effect of acupressure on waist circumference (WC), waist-to-hip ratio (WHR), body fat percentage (BFP), and body fat mass (BFM), comparing with control groups. The mean differences between the experimental and control groups for WC (A), WHR (B), BFP (C), and BFM (D) were −1.54 cm (P < .001), −0.011 (P < .001), −1.20% (P < .001), and −0.89 kg (P = .02), respectively.
