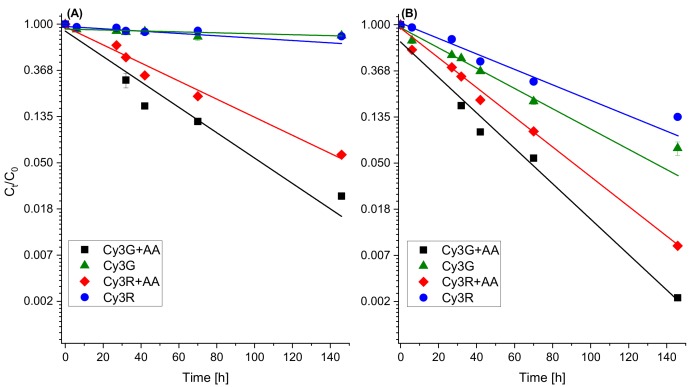
Figure 5.
Stability of Cy3G and Cy3R in buffered solutions (pH 4.5 (A); and pH 6.5 (B)) over time with and without AA, stored at 37 °C. Quantification was made by HPLC absorbance of the peak at 516 nm and presented as relative concentration of the peak area divided by the initial peak area. Error bars represent standard error (n = 2). In most cases, they are smaller than the symbols.

