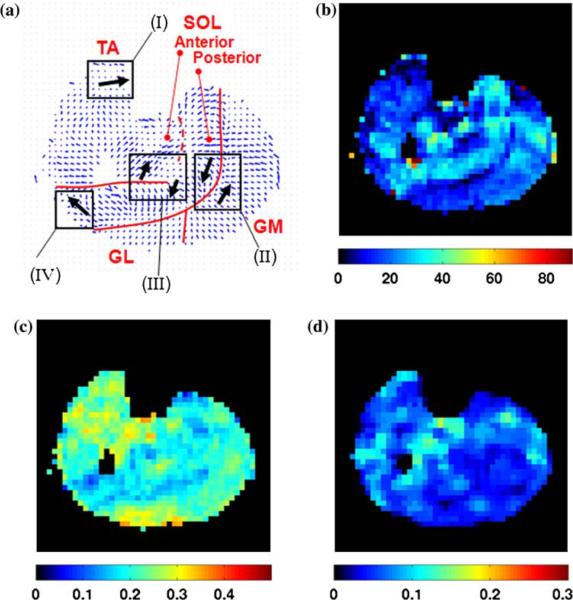
FIGURE 4.
DTI parameters maps for the central slice of subject 1: (a) primary eigenvector map, (b) map of the zenith angle of the primary eigenvector (values in degrees), (c) FA, and (d) CP maps (non-dimensional parameters). Red lines delineate the aponeurosis between GM and SOL and the anterior aponeurosis of the SOL. Dash line marks the approximate position of part of the anterior aponeurosis. Regions marked (I–IV) pertain to the discussion section.

