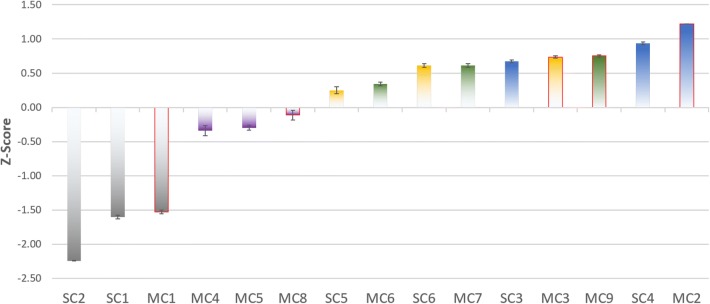
Fig. 4.
Comparison of the mean z-scores obtained by the different models and error bars indicate SEM. Bars are colored by compound features, which are blue bars for Mol2vec, green bars for ECFP, yellow bars for ECFP, purple bars for Mol2vec, and grey bars for SMILES. The bars highlighted with red border indicate the usage of ProtVec, which demonstrates better performance than other protein features

