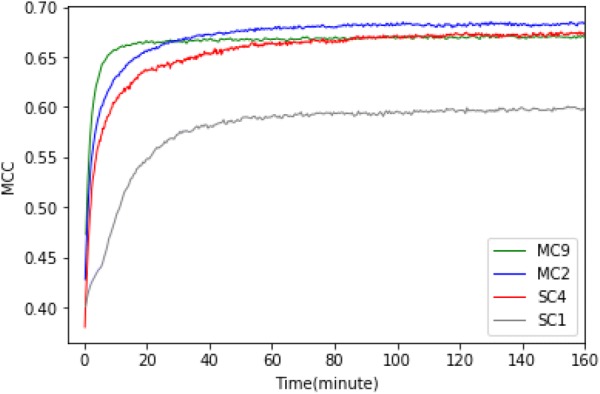
Fig. 5.

Comparison of convergence performance between two MCPINN and two SCPINN. The plot shows the Matthews Correlation Coefficient of models on y-axis against the actual training time in minutes on the x-axis

Comparison of convergence performance between two MCPINN and two SCPINN. The plot shows the Matthews Correlation Coefficient of models on y-axis against the actual training time in minutes on the x-axis