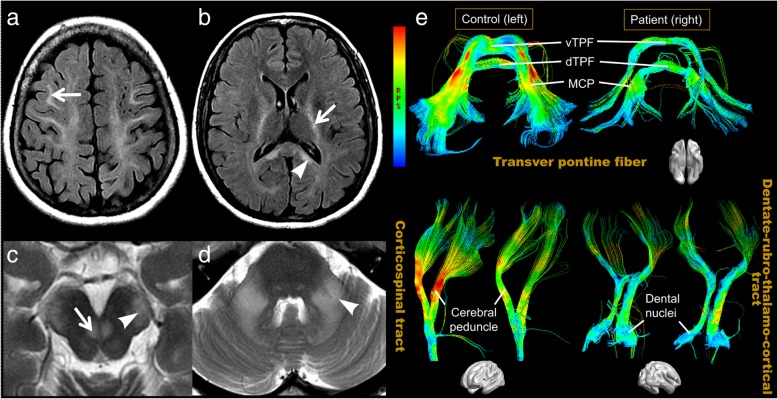
Fig. 2.
Conventional brain magnetic resonance imaging (MRI) and diffusion tensor tractographies (DTTs) of the patient. Axial T2-FLAIR (a, b), and T2-weighted (c, d) MRI of the patient demonstrate abnormal hyperintensities in the bilateral frontal (a, arrow) and parietal white matter and the splenium (arrowhead, b) of the corpus callosum, internal capsule (arrow, b), cerebral peduncle (arrowhead, c), DSCP (arrow, c), and middle cerebellar peduncle (arrowhead, d). On DTT (e), the CST, transverse pontine fibers, and dentate nucleus tracts of the patient are obviously thinner and have a “darker color” in the pathological tracts, which indicates lower fractional anisotropy (FA) values, when compared with those in a control. DSCP = decussation of the superior cerebellar peduncle, CST = corticospinal tract, vTPF = ventral transverse pontine fiber, dTPF = dorsal transverse pontine fiber, MCP = middle cerebellar peduncle

