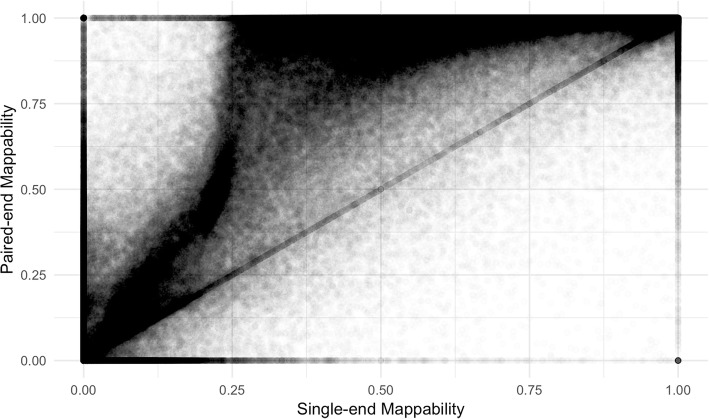
Fig. 1.
Comparison of single-end and paired-end TE mappability. Each point represents 1 TE sequence. Paired-end mappability scores were generated from 76 base pair read alignments with <= 3 mismatches. Single-end mappability scores were generated from GEM Mappability (k = 76) with the default of a 4% mismatch rate. Mappability scores were aggregated for each TE as the percent of base pairs in the sequence with a unique mappability score

