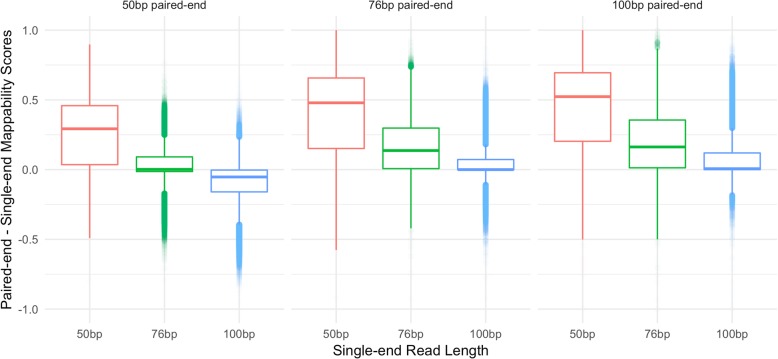
Fig. 7.
Difference in paired-end and single-end mappability scores across combinations of library sizes. Boxplots show the distribution of the differences between paired-end mappability scores (specified above the boxplots) and single-end mappability scores (specified along the x-axis) for each combination of 50 bp, 76 bp, and 100 bp paired and single-end libraries. The scores shown here exclude TE loci where all three paired-end libraries have 100% unique scores and where length < 300 bp in order to allow for a fair comparison with the 100 bp paired-end library. Points < 0 signify a higher single-end than paired-end mappability score and points > 0 signify a higher paired-end than single-end mappability score

