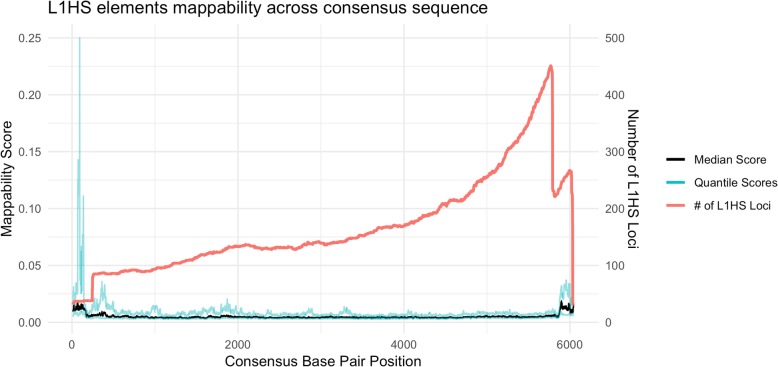
Fig. 9.
Mappability along the L1HS consensus sequence. The black line is the median mappability scores across L1HS elements and the blue lines are the 1st and 3rd quartile scores. The x axis represents the base positions along the consensus sequence. The red line is a density line of the number of loci present at that base position of the consensus sequence

