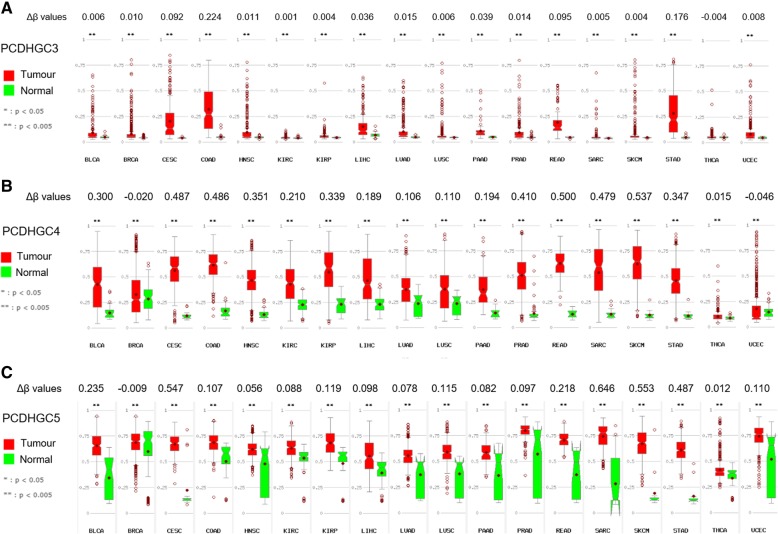
Fig. 10.
Box plots of the methylation values in tumour and normal tissues from different cancers, obtained from the in silico dataset TCGA. Differential methylation (Δβ) values of the CGIs of PCDHGC3 (a), PCDHGC4 (b) and PCDHGC5 (c) were calculated between tumour and normal tissues. BLCA bladder urothelial carcinoma, BRCA breast invasive carcinoma, CESC cervical squamous cell carcinoma and endocervical adenocarcinoma, COAD colon adenocarcinoma, HNSC head and neck squamous cell carcinoma, KIRC kidney renal clear cell carcinoma, KIRP kidney renal papillary cell carcinoma, LIHC liver hepatocellular carcinoma, LUAD lung adenocarcinoma, LUSC lung squamous cell carcinoma, PAAD pancreatic adenocarcinoma, PRAD prostate adenocarcinoma, READ rectal adenocarcinoma, SARC sarcoma, SKCM skin cutaneous melanoma, STAD stomach adenocarcinoma, THCA thyroid carcinoma, UCEC uterine corpus endometrial carcinoma

