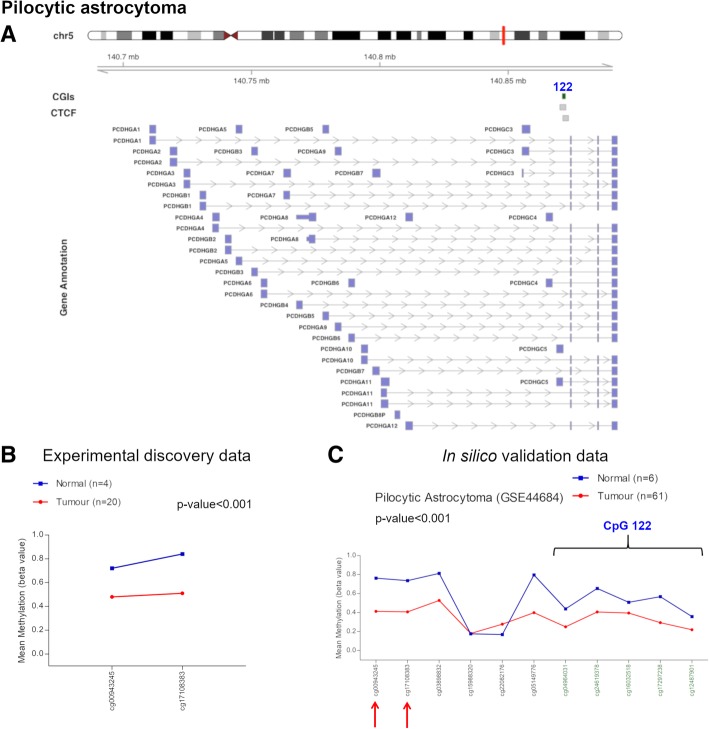
Fig. 2.
Methylation values obtained from the pilocytic astrocytoma discovery dataset and the in silico data. a Genomic organization of PCDHG@, including the localization of exons, CGIs (annotated with the UCSC CGI names) and CTCF binding sites. b Mean β values, resulting from the average of the samples (normal and tumour), of each probe obtained using Infinium HumanMethylation27 BeadChip. These two probes correspond to the N-shelf region of the CpG 122 (chr5:140871064-140872335), altered in our analysis. c Mean methylation values of each probe, belonging to the CpG 122 (green) and to its flanking region (black), obtained from the in silico dataset GSE44684. The red arrows indicate the two probes used in our experimental study

