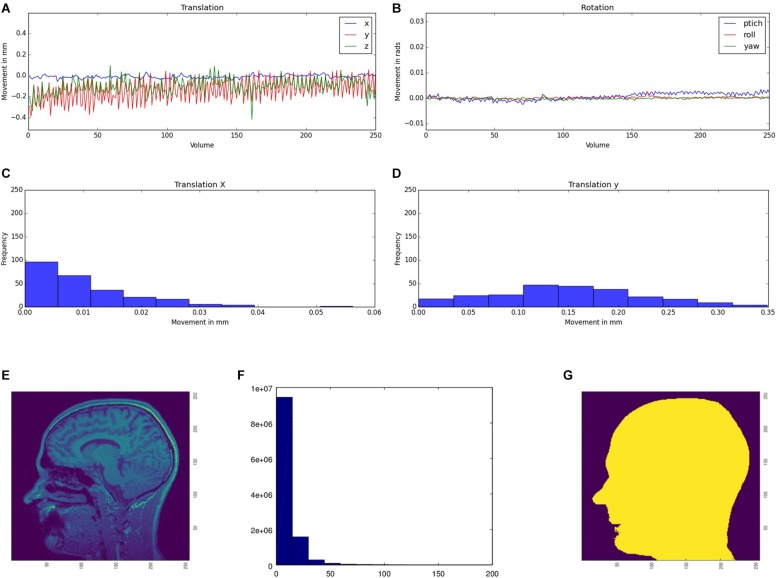
FIGURE 3.
Head movement parameters [translation (A) and rotation (B)] for functional MRI data. The movement parameters are transferred into a histogram, illustrating the amount of movement between two consecutive time points (exemplarily shown for the x (C) and y (D) translation parameters). Original structural image (E), the calculated mask (F), and the histogram of the basal noise (G).

