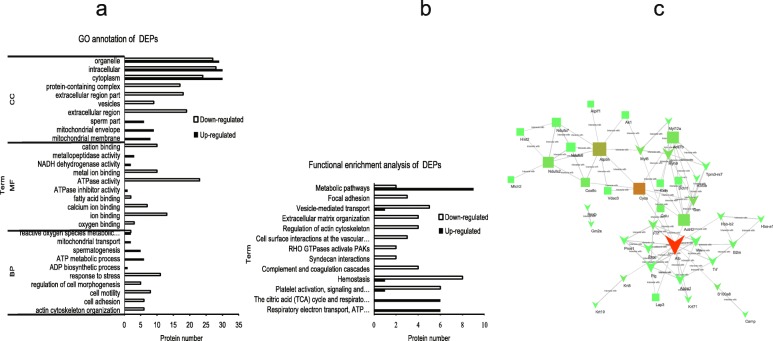
Fig. 1.
Bioinformatic analyses of differently expressed proteins (DEPs). a Gene ontology (GO) analysis of DEPs. b Functional enrichment analysis of DEPs. c Protein–protein interaction (PPI) network of DEPs from HT and LT pigs. The nodes represent DEPs, and the edges between the nodes indicate interactions between two connecting DEPs. The node colors indicate the betweenness of interaction the nodes: the color is redder, the betweenness is bigger, which means the influence is greater in the network. The node sizes indicate the degree of interaction between the nodes: the size is bigger, the degree is bigger, which means the stability is stronger in the network. The node shapes represent upregulated proteins (rectangle) or downregulated proteins (v). The degrees of edge thickness represent the protein–protein interaction scores

