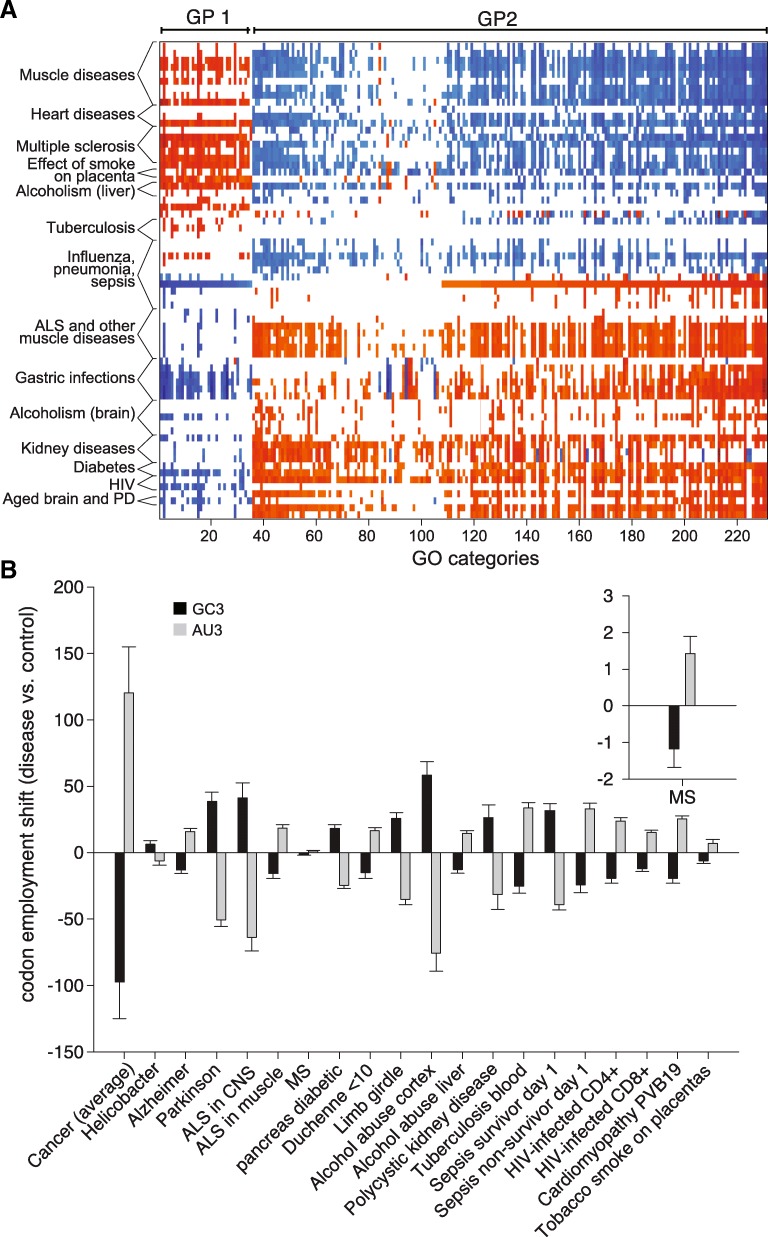
Fig. 8.
Applying the analysis of the codon employment shift to several diseases. a. Graphic depiction of the favored or disfavored GO categories in multiple diseases (see Additional file 7 for detailed references of the datasets taken into consideration). The Y- axis indicates different diseases, while the X-axis indicates different GO categories that were significantly correlated to the employment shift (red) or anti-correlated (blue) in at least 10 different diseases. The different colors indicate the normalized enrichment score, calculated as in Fig. 7. The first 35 GO groups belong to the GP1 genes. Several more detailed examples are included in Additional files 8, 9, 10, 11, 12, 13, 14, 15, 16 and 17. b. Codon employment shift in the different diseases, calculated as for the insets of Fig. 6A-B. The inset highlights the smallest change measured, in multiple sclerosis (MS). ALS = amyotrophic lateral sclerosis. Cardiomyopathy PVB19 = cardiac inflammation and damage following parvovirus infection. We only employed in this figure studies that also provided sufficient numbers of control (non-disease) patients

