

Abstract
The upgrading of complex bio‐renewable feedstock, such as lignocellulose, through depolymerisation benefits from the selective reactions at key functional groups. Applying homogeneous catalysts developed for selective organic oxidative transformations to complex feedstock such as lignin is challenged by the presence of interfering components. The selection of appropriate model compounds is essential in applying new catalytic systems and identifying such interferences. Here, it was shown by using as an example the oxidation of a model substrate containing a β‐O‐4 linkage with H2O2 and an in situ‐prepared manganese‐based catalyst, capable of efficient oxidation of benzylic alcohols, that interference from compounds liberated during the reaction can prevent its application to lignocellulose depolymerisation.
Keywords: catalysis, inhibition, lignin, manganese, oxidation
Introduction
Lignin is one of the most abundant biopolymers on earth. It is a heterogeneous tri‐dimensional phenolic polymer built from phenyl propane units linked by various groups.1, 2, 3 In combination with cellulose and hemicellulose, it forms cellulosic fibre walls that impart rigidity to trees and protection from oxidative degradation caused by microorganisms.4 The structural complexity of lignin is a key aspect of its functionality (protection for plants) but presents a challenge to its use as a source of chemicals and complicates processes such as cellulose‐based ethanol production.5, 6, 7, 8 Its separation from the carbohydrate components in pulp and paper manufacturing is challenging and energy‐intensive.9, 10, 11 Efficient, economic and sustainable depolymerisation pathways that enable liberation of cellulose from lignocellulosic materials have been a major focus over the last decades.2 The β‐O‐4 linkage (Figure 1) is the most abundant (≈55 %) linkage in lignin polymers.2, 3 Hence, the oxidation of the functional groups adjacent to this linkage and particularly at benzylic positions represents an attractive starting point for lignin depolymerisation.1, 2, 12, 13, 14, 15
Figure 1.
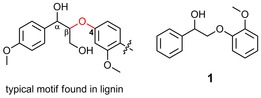
β‐O‐4 linkage (red) in lignin and a lignin model compound (1) bearing the characteristic β‐O‐4 linkage and a guaiacol motif.16.
Selective oxidative depolymerisation of lignin with homogeneous catalysts is a promising approach in terms of energy efficiency and offers opportunities to make use of a wide range of ligands and complexes already available for small‐molecule oxidation. Given the scale of the process, catalysts based on first‐row transition metals together with simple ligands are especially relevant. A further consideration is to distinguish between hard and soft wood pulp and especially the relative abundance of chemical linkages, with softwood lignin containing primarily coniferyl alcohol‐based components and hardwood a large number of components from sinapyl alcohol.17 Furthermore, the atom‐economic terminal oxidants O2 and H2O2 are favoured owing to their non‐persistent toxicity and environmental impact.
Biomimetic metalloporphyrin catalysts, functionalized with halogens and sulfonate groups18, 19, 20, 21 as well as Fe‐porphyrins,12 Co(salen)15, 22, 23, 24 and polyoxometalate‐based compounds9, 10, 11, 25, 26, 27, 28 have been applied in oxidation catalysis over the last decades, including in delignification. In contrast, non‐porphyrin‐based metal complexes have drawn only modest attention, for example, with the ligands tetra‐amido macrocycle (TAML), 1,4,7‐trimethyl‐1,4,7‐triazacyclononane (Me3TACN) and 1,2‐bis‐(4,7‐dimethyl‐1,4,7‐triazacyclonon‐1‐yl)‐ethane (DTNE).29 Nevertheless, catalysts such as [(Me4DTNE)MnIV 2(μ‐O)3](ClO4)2 and [(Me3TACN)MnIV 2(μ‐O)3](PF6)2 have shown good performance in the delignification of softwood (e.g., Kraft‐AQ) pulps with H2O2.30, 31, 32 It is notable that biphenyl (5‐5) and stilbene structures are degraded preferentially, with β‐O‐4, β‐5 and β‐β linkages undergoing degradation to a lesser extent; they are therefore more efficient in the delignification of the soft rather than hardwood pulp. Hence, there is a need for catalysts that target the breakup of lignin through attack of, for example, β‐O‐4 linkages.
Recently, we reported a manganese(II) catalyst prepared in situ with pyridine‐2‐carboxylic acid (PCA) and sub‐stoichiometric ketones for the oxidation with H2O2 of a broad range of organic compounds such as alkanes, olefins, aliphatic and benzylic alcohols under ambient conditions with high turnover numbers (up to 300 000 for the epoxidation of electron‐rich alkenes) and low catalyst loadings (Scheme 1).33, 34, 35, 36, 37, 38, 39 The simplicity of the catalyst in preparation and, importantly, its wide solvent scope make it a potential candidate for large‐scale application. In particular, the good conversion shown in the oxidation of secondary benzylic alcohols, such as p‐X‐1‐phenylethanol (X=H, Br, OCH3) and aromatic vicinal diols to ketones, even if the benzylic alcohol positions were protected as ethers, encouraged us to consider the potential of this Mn system in catalytic lignin degradation, in particular for attack at the β‐O‐4 linkage.34, 39
Scheme 1.
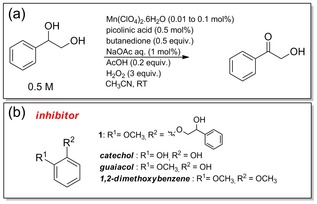
(a) Typical conditions employed in the manganese‐catalysed oxidation of 1‐phenyl‐1,2‐ethanediol to the corresponding ketone product (see main text for details); (b) potential inhibitors studied.
We show here that an unexpectedly low conversion was observed if the MnII/PCA/butanedione catalytic system was applied to lignin model compounds such as 2‐(2‐methoxyphenoxy)‐1‐phenylethanol (1) (Figure 1). Catalytic oxidation in the presence of mono and di‐oxygenated aromatic compounds such as catechol, which are typical motifs present in lignin, are responsible for (temporary) deactivation of our MnII/PCA/butanedione‐based catalyst through coordination to the metal centre. The binding of catechol‐type compounds to manganese is well documented,40 as is the formation of high‐valence manganese complexes from such ligands in natural systems.41 A combination of spectroscopic studies and competition experiments establish the propensity of catechol motifs to interact with the catalyst. The coordination of phenolic groups to manganese is explored; however, in contrast to most non‐heme catalysts, especially non‐heme iron complexes, for which complexation leads to a loss of catalytic activity,42, 43, 44 inhibition in the MnII/PCA/butanedione system is shown to be dependent on inhibitor concentration as well as time. The conclusions reached hold implications for the application of other transition‐metal‐based complexes and especially for understanding catalyst inhibition mechanisms.
Results and Discussion
The oxidation of 1‐phenyl‐1,2‐ethanediol and 1 with H2O2 was studied here by using conditions optimized earlier for the oxidation of secondary aliphatic and benzylic alcohols.34 With the in situ‐prepared manganese catalyst (Scheme 1), 1‐phenyl‐1,2‐ethanediol underwent 60 % conversion to the corresponding α‐hydroxyketone, as reported previously.39 Surprisingly, only minor (<10 %) conversion of 1 was achieved under these conditions (Figure S1 in the Supporting Information). The low conversion was not owing to loss of H2O2 because it remained in solution unreacted. Notably, the conversion to ketone product, that is, the turnover number was approximately 100 regardless of whether the initial concentration of 1 was 0.05 or 0.5 m (Figure S1 in the Supporting Information), which is consistent with the zero‐order dependence on the substrate of the reaction observed previously.38
Inhibition of manganese catalyst by 1 and phenols
The origin of the lack of conversion was explored through the effect of 1 on the conversion of 1‐phenyl‐1,2‐ethanediol (Figure 2) to the corresponding α‐hydroxyketone. The conversion decreased from 60 to 0 % as the concentration of 1 increased, with the most pronounced decrease between 5 and 20 mol % of 1 (with respect to 1‐phenyl‐1,2‐ethanediol). Notably, the duration over which oxidation of 1‐phenyl‐1,2‐ethanediol was observed (with <50 mol % 1) was unaffected, but instead the rate decreased. Furthermore, the H2O2 was consumed to a concomitantly lesser extent, excluding that wasteful degradation of H2O2 is responsible for the decrease in conversion (Figure S2 in the Supporting Information).
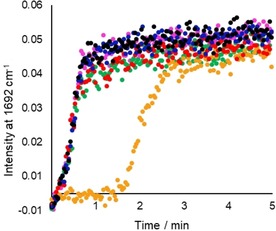
Figure 2.
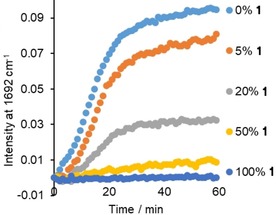
Formation of 2‐hydroxyacetophenone upon oxidation of 1‐phenyl‐1,2‐ethanediol in the absence (light blue) and presence of 5, 20, 50 and 100 mol % of 1 followed through the intensity of the Raman band (λ exc=785 nm) of the carbonyl stretch of the product at 1692 cm−1. With 0.01 mol % MnII. See Scheme 1 for conditions.
The oxidation rate of 1‐phenyl‐1,2‐ethanediol was lower if the diol was added 5 min after addition of H2O2 compared with the rate if it was present before addition of H2O2, confirming that the effect on catalytic activity was owing to the presence of 1. The difference between 1‐phenyl‐1,2‐ethanediol and 1 lies in the guaiacol moiety of the latter, and indeed addition of 5 mol % of guaiacol was sufficient to see a complete suppression of the catalytic oxidation of 1‐phenyl‐1,2‐ethanediol (Figure 3). These data indicate that guaiacol or simple phenolic compounds are responsible for the loss in catalytic activity, as confirmed by the inhibition observed with several mono and di‐oxygenated aromatic compounds. The inhibition by 1,2‐dimethoxybenzene was much less pronounced than the inhibition observed with phenol and especially ortho‐dihydroxylated catechol (which showed complete inhibition), indicating that alcohol groups available for coordination are important (Figure 3).
Figure 3.
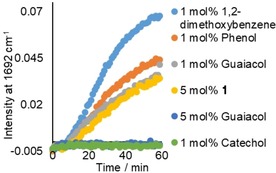
Formation of 2‐hydroxy‐acetophenone by oxidation of 1‐phenyl‐1,2‐ethanediol with 0.01 mol % MnII in the presence of 1 mol % (5 mm) dimethoxybenzene (light blue), phenol (orange), guaiacol (grey), catechol (green) and 5 mol % (25 mm) 1 (yellow) and guaiacol (dark blue); 1‐phenyl‐1,2‐ethanediol was added 5 min after addition of H2O2. The formation of the ketone product, 2‐hydroxyacetophenone, was monitored by following the increase of the band at 1692 cm−1 by in‐line Raman spectroscopy (λ exc=785 nm). Solvent bands served as internal reference. See Scheme 1 for conditions.
Notably, however, a tenfold increase in [MnII] (to 0.5 mm) resulted in inhibition only by catechol, and even so after a short delay the reaction proceeded at the same rate as without inhibitor (Figure 4, see below).
Figure 4.
Formation of 2‐hydroxy‐acetophenone by oxidation of 1‐phenyl‐1,2‐ethanediol with 0.1 mol % MnII (black) in the presence of 1 mol % of dimethoxybenzene (blue), phenol (red), guaiacol (green), catechol (orange) or 1 (pink). The formation of the ketone product, 2‐hydroxyacetophenone, was monitored by following the increase of the band at 1692 cm−1 by in‐line Raman spectroscopy (λ exc=785 nm). Solvent bands served as internal reference. See Scheme 1 for conditions.
Reaction of MnII with catechol in absence of H2O2
The reaction of catechol with the manganese catalyst prior to the addition of H2O2 was studied by (resonance) Raman, UV/Vis absorption spectroscopy and cyclic voltammetry. Addition of catechol [in a hundredfold excess with respect to Mn(ClO4)2] to a mixture of Mn(ClO4)2, PCA and 1‐phenyl‐1,2‐ethanediol in CH3CN resulted in the appearance of an absorption band at 600 nm, reaching a maximum absorbance within 2–3 min. An additional absorption band at 410 nm was noticeable after 6 min, but in contrast to the band at 600 nm, the 410 nm band continued to increase in absorbance over 1 h (Figure 5 a). With a tenfold increase in [MnII] (10:1 ratio of catechol/MnII) the maximum absorbance at 600 nm also increased tenfold (Figure 5 b); however, although the band at 410 nm appeared more rapidly and with greater absorbance, it did not increase more than a few fold over that with the lower concentration of MnII (Figure 5 b).
Figure 5.

UV/vis absorption spectrum (path length 2 mm) of 1‐phenyl‐1,2‐ethanediol (0.5 m), PCA (2.5 mm) and Mn(ClO4)2 6 H2O [(a) 0.05 and (b) 0.5 mm] in CH3CN before (blue) and following addition of catechol (5 mm). Right: change in absorbance at 410 (blue) and 620 nm (orange) over time.
These bands were not observed in the absence of 1‐phenyl‐1,2‐ethanediol or catechol (Figures S3 and S4 in the Supporting Information). Surprisingly, although it was present in a large excess, the relative amount of 1‐phenyl‐1,2‐ethanediol also had a significant effect on the two absorption bands (Figure S5 in the Supporting Information). The maximum absorbances at 410 and 600 nm increased with the concentration of 1‐phenyl‐1,2‐ethanediol until 0.5 m, and thereafter the changes were less pronounced. The large excess needed indicates that complexation to manganese by the diol is not significant but instead the relative basicity of the solution is important (see below).
The rate and extent of formation of the absorption band at 600 nm was unaffected by the absence of O2, in contrast to the absorption band at 410 nm, which increased more rapidly with O2‐purged solutions and hardly appeared in N2‐purged solutions (i.e., only residual oxygen reacted, Figure 6). Notably, the rate of increase in absorption at 620 nm was similar regardless of the concentration of O2, but the induction period observed in air‐equilibrated solutions was absent in O2‐purged solutions, indicating that oxygen plays the role of initiator. The presence of both catechol and 1‐phenyl‐1,2‐ethanediol (in large excess) was essential for the appearance of both bands. Aliphatic diols such as glycerol did not show similar effects. The presence of PCA, which was essential for catalysis with H2O2, had no effect on the changes observed (Figure S6 in the Supporting Information).
Figure 6.
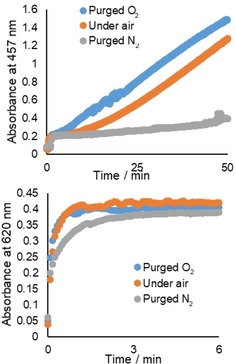
Absorbance (2 mm path length) at 457 and 620 nm over time for solutions of PCA (2.5 mm) and 1‐phenyl‐1,2‐ethanediol (0.5 m) in CH3CN after the addition of Mn(ClO4)2 6 H2O (0.5 mm) and catechol (5 mm) in air‐equilibrated CH3CN, and with prior O2 (blue) or N2 (grey) purge. The absorbance at 457 nm was used to track the increase in the band at 410 nm because the absorbance at 410 nm reached >2 within a few minutes.
Raman spectra recorded at λ exc=632.8 nm (i.e., in resonance with the 600 nm absorption band) show the appearance of bands at 624, 1264, 1324, 1474 and 1569 cm−1 concomitant with the changes in absorbance at 600 nm (Figure 7). The bands at 1264 and 1474 cm−1 are characteristic of the catecholate C−O stretching modes, and the absorbance at 600 nm is typical of LMCT (ligand‐to‐metal charge transfer) bands of MnIV catecholate species. The absorbance reached (≈0.45, Figure 5 b) is consistent with the molar absorptivity of [MnIV(catecholato)3]2− (4500 m −1 cm−1).45, 46, 47, 48, 49, 50 These data indicate that in the first 2–3 minutes of the reaction the deep blue [MnIV(catecholato)3]2− was formed.
Figure 7.
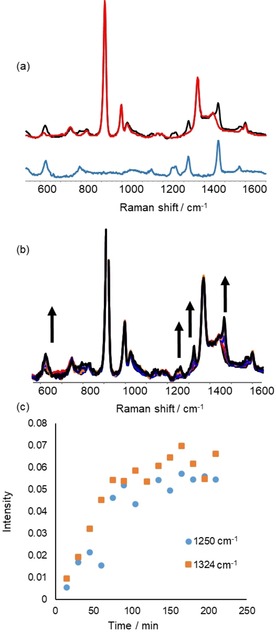
Catechol (5 mm) was added to Mn(ClO4)2 6 H2O (0.5 mm), PCA (2.5 mm) and 1‐phenyl‐1,2‐ethanediol (0.5 m) in CH3CN. (a) Raman spectra (λ exc=632.8 nm) recorded before (red) addition of catechol and after the absorption band at 600 nm had reached a maximum (black). The difference spectrum showing resonantly enhanced bands only is in blue. (b) Spectra recorded over time. (c) Intensity of bands at 1250 and 1324 cm−1 over time.
Raman spectroscopy at λ exc=355 nm (i.e., resonant with the 410 nm absorption band), showed the appearance of the bands at 795, 1235, 1550 and 1665 cm−1, after a delay of approximately 6 min (Figure 8) that was consistent with the lag time observed by UV/Vis spectroscopy (Figure 5 a). Moreover, the change in intensity of the Raman bands at 1550 and 1665 cm−1 over time tracked the change in absorbance at 410 nm. The Raman bands at 1550 and 1665 cm−1 are characteristic of quinone C−O stretching modes and may indicate the formation of a quinone dimer.51, 52, 53 Addition of catechol (1 mol %) to 1‐phenyl‐1,2‐ethanediol in the absence of Mn(ClO4)2 resulted in the appearance of an absorption band at 410 nm over 60 min together with an unassigned band at 340 nm (Figure S7 in the Supporting Information) that was absent in the presence of Mn(ClO4)2. The maximum absorbance reached, however, was much less than in the presence of Mn(ClO4)2.
Figure 8.
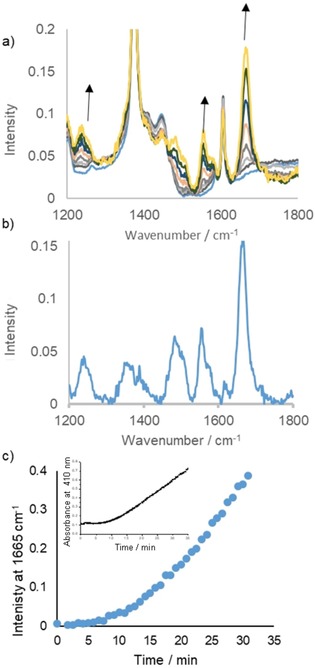
Raman spectra (λ exc=355 nm) of Mn(ClO4)2 6 H2O (0.05 mm), PCA (2.5 mm) and 1‐phenyl‐1,2‐ethanediol (0.5 m) in CH3CN. (a) Before (blue) and after the addition of catechol (5 mm). (b) Difference spectrum [Raman spectrum at 33.3 min (red) minus spectrum at 8 min (blue)]. (c) Raman intensity at 1665 cm−1 and (inset) absorbance at 410 nm over time.
Influence of reaction components on redox chemistry and UV/Vis spectroscopy of catechol
The cyclic voltammetry of catechol in CH3CN showed an expected oxidation wave at approximately 1.0 V and reduction of the dimer formed by radical coupling at 0.5 V. Addition of 1‐phenyl‐1,2‐ethanediol, which is itself redox inactive, had a pronounced effect on the cyclic voltammetry of catechol with an almost 1 V shift in the redox potential of catechol towards negative potentials (Figure 9). The addition of MnII salts and PCA at the same concentrations as present under catalytic conditions did not affect the voltammetry significantly. These changes indicate that the diol facilitates oxidation of the catechol by MnII and O2 simply as a proton acceptor (see below). Indeed, the preparation of the complex MnIV(catecholato)3]2− requires addition of a base.45, 46, 47, 48, 49, 50
Figure 9.
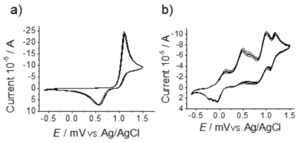
Cyclic voltammetry in CH3CN, 0.1 m Bu4PF6 as electrolyte with saturated Ag/AgCl as reference electrode and scan rate of 0.1 V s−1 (a) Catechol (5 mm); (b) catechol (5 mm), PCA (2.5 mm),1‐phenyl‐1,2‐ethanediol (0.5 m) and Mn(ClO4)2 6 H2O (0.5 mm).
The addition of butanedione, a major reaction component typically present in 25 mol %, immediately induced a reduction of both the putative MnIV(catecholato)3 species (absorbing at 600 nm) and the species responsible for the absorption band at 410 nm. However, the absorbance at 600 nm reappeared eventually after addition of butanedione (Figure 10 a, see the absorbance at 600 nm vs. time). The open‐circuit potential in time (Figure S8 in the Supporting Information) as well as the cyclic voltammetry (Figure S9 in the Supporting Information) indicated that the recovery of the MnIV complex was inhibited by the lower redox potential of the solution, highlighted by a shift in the oxidation potential by 0.5 V. The addition of AcOH, which was formed in situ rapidly through oxidation of butanedione under reaction conditions, resulted in immediate disappearance of the bands at 410 and 600 nm, with the former band largely obscured by the butanedione present. These changes are consistent with the positive shift in the oxidation potential of the catechol (Figure S9 in the Supporting Information) and inhibition of complexation to manganese expected upon protonation of catechol.
Figure 10.
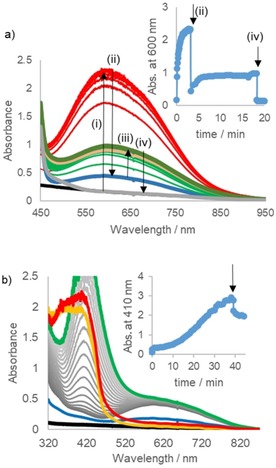
UV/Vis absorption spectrum (2 mm path length) of Mn(ClO4)2 6 H2O (0.5 mm), PCA (2.5 mm) and 1‐phenyl‐1,2‐ethanediol (0.5 m) in CH3CN (black).(a) after addition of catechol (5 mm) (i), immediately after addition of 0.5 equiv. butanedione at 3.2 min (ii), subsequent changes (iii) and after addition of acetic acid at 18 min (iv); (b) with addition of butanedione and AcOH 39 and 46 min after addition of catechol, respectively. The absorbances at 600 and 410 nm over time are shown as insets, respectively.
Effect of catechol on induction period in the catalysed oxidation of 1‐phenyl‐1,2‐ethanediol
Although UV/Vis absorption spectroscopy indicated formation of catechol oxidation products and the MnIV(catecholato)3 species, these species underwent reduction in the presence of butanedione and AcOH. However, the relation between inhibition period and catechol concentration (Figure 11) indicated that the oxidation of catechol proceeded under reaction conditions. If the concentration of catechol was close (0.05 and 0.2 mol % with respect to the diol or 5 and 20 equiv. with respect to MnII) to that of MnII, the oxidation of 1‐phenyl‐1,2‐ethanediol with H2O2 proceeded smoothly. If the catechol concentration exceeded that of MnII (40–60 equiv.), inhibition was observed regarding the initial lag phase, but once conversion commenced it proceeded at the same rate regardless of initial catechol concentration (Figure 11). Above 60–100 equiv. of catechol with respect to manganese, however, conversion was not seen even over several hours (Figure 11), and there also was negligible consumption of H2O2. Hence, although we cannot be certain that the duration of the inhibition period is related to the rate of catechol oxidation, there is a clear correlation indicating that this is the case.
Figure 11.

Oxidation of 1‐phenyl‐1,2‐ethanediol (0.5 m) in the presence of Mn(ClO4)2 6 H2O: 0.25 mm (black), 1 mm (red), 2.0 mm (blue), 2.5 mm (green), 3.0 mm (pink) and 5.0 mm catechol (orange); The formation of 2‐hydroxy‐acetophenone was followed through the Raman band at 1692 cm−1 (λ exc=785 nm). See Scheme 1 for conditions and Figure S10 in the Supporting Information for changes at 864 (H2O2) and 842 cm−1 (substrate).
Addition of catechol (0.5 mol %) 10 min after addition of H2O2 resulted in a halt of the oxidation of 1‐phenyl‐1,2‐ethanediol, with the same induction period (50 min) as observed if catechol and 1‐phenyl‐1,2‐ethanediol were present before addition of H2O2 (Figure 12). Similarly, if 1‐phenyl‐1,2‐ethanediol was added 5 min after addition of H2O2 (Figure 12), the induction period was also approximately 50 min, indicating that regardless of the addition sequence of reagents, the same lag time was observed.
Figure 12.

Oxidation of 1‐phenyl‐1,2‐ethanediol (0.5 m) in the presence of catechol (1 mm): catechol and 1‐phenyl‐1,2‐ethanediol present before addition of H2O2 (red), catechol added 10 min after addition of 1‐phenyl‐1,2‐ethanediol and H2O2 (black), 1‐phenyl‐1,2‐ethanediol added 5 min after addition of catechol and H2O2 (blue). The formation of the ketone product was determined from the intensity of the band at 1692 cm−1 in the Raman spectrum (λ exc=785 nm) of the reaction mixture. See Scheme 1 for conditions and Figure S11 in the Supporting Information for changes at 864 (H2O2) and 842 cm−1 (substrate).
Mechanistic considerations
Although the oxidation of 1 to its corresponding ketone proceeded with a turnover number of approximately 100, it is clear that inhibition by a species produced during oxidation occurred. The inhibition in the oxidation of 1‐phenyl‐1,2‐ethanediol in the presence of 1 confirmed this conclusion. In the first instance, the release54 of guaiacol from 1 was a likely candidate as inhibitor. Indeed, inhibition by catechol and a variety of phenolic compounds was observed. This inhibition is of relevance to the use of this catalytic system in the oxidation of lignocellulose because such motifs are abundant. UV/Vis and resonance Raman spectroscopic data show that catechol formed the known blue complex [MnIV(catecholato)3]2− in the presence of 1‐phenyl‐1,2‐ethanediol, and under aerobic conditions the catechol underwent oxidation manifested in the absorption band at 410 nm.55, 56 The presence of 1‐phenyl‐1,2‐ethanediol was essential to the observation of this species owing to the need for a proton acceptor; it should be noted that the formation of the MnIV complex required the addition of a base. In the presence of butanedione and/or acetic acid, the MnIV complex rapidly disappeared, presumably owing to reduction to the relatively colourless MnII or MnIII state. These changes are consistent with the effect of alcohol, butanedione and acetic acid on the cyclic voltammetry of catechol in CH3CN, specifically the potential for catechol oxidation. Hence, although the formation of catechol manganese(IV) complexes can occur, the formation of similar complexes under reaction conditions can only be speculated upon. However, the inhibition of the catalyst under reaction conditions by catechol depended on its concentration relative to the concentration of manganese ions. If near‐stoichiometric amounts were used the inhibition was apparent. After a lag time that depended on initial catechol concentration (relative to manganese), the oxidation of 1‐phenyl‐1,2‐ethanediol proceeded with the same rate as in the absence of catechol. Hence, phenolic compounds act as sacrificial inhibitors rather than permanently deactivate the catalyst.
The inhibition of the catalyst in the oxidation of 1 is unlikely to be owing to oxidation products of 1 such as mandelic acid because the concentrations of these compounds under reaction conditions were insufficient to inhibit reactivity (Figure S12 in the Supporting Information); nor is it caused by guaiacol residue from the synthesis of 1 because it is not present in sufficient amounts (determined by 1H NMR spectroscopy) to cause the inhibition observed in the oxidation of 1‐phenyl‐1,2‐ethanediol in the presence of 1. The formation of guaiacol from 1, for example, by one‐electron oxidation,16 is reasonable but owing to its subsequent oxidation under reaction conditions it is not possible to confirm its presence under reaction conditions.
Conclusions
Spectroscopic analysis confirms the tendency of phenolic compounds such as catechol to chelate manganese and to undergo oxidation in the presence of aromatic diols such as 1‐phenyl‐1,2‐ethanediol. Under reaction conditions, catechol can inhibit the activity of the catalyst through chelation but oxidation eventually “releases” the manganese ions to reform the catalytic system. The presence of such species in lignin therefore is likely to impact the effectiveness of the catalytic system and increases the concentration of manganese required for the oxidative degradation of the polymer. However, the formation of other potentially chelating compounds (such as mandelic acid derivatives) during the oxidation is likely to have a greater impact because these are less susceptible to removal by further oxidation. These results emphasise the challenge in translating results from reactions with model compounds to the complex mixtures of compounds encountered with biorenewable resources. Indeed, the success of robust complexes such as [(Me4DTNE)MnIV 2(μ‐O)3](ClO4)2 [DTNE=1,2‐bis‐(4,7‐dimethyl‐1,4,7‐triazacyclonon‐1‐yl)‐ethane] and [(Me3TACN)MnIV 2(μ‐O)3](PF6)2 [Me3TACN=1,4,7‐trimethyl‐1,4,7‐triazacyclononane] used in soft‐wood oxidation highlights the need to build similar robust catalysts for oxidation of β‐O‐4 linkages in lignin. In the present study, we have explored the use of a manganese‐based catalyst that was prepared in situ. Although simple and economic, the lability of the ligand (pyridine‐2‐carboxylic acid) as well as the low concentrations used mean that even low concentrations of other potential ligands can bind the manganese ions and inhibit oxidation. Hence, the development of polydentate ligand‐based catalysts is ultimately necessary in applications involving complex mixtures such as lignin.
Experimental Section
All reagents were obtained from commercial sources and used as received unless stated otherwise. Solvents were of HPLC grade or better. 1 was prepared as reported elsewhere.57
Oxidation catalysis: Stock solutions containing Mn(ClO4)2⋅6 H2O (0.1 μmol, 0.01 mol % or 1 μmol, 0.1 mol %) and PCA (5 μmol, 0.5 mol %) were mixed at room temperature for 20 min. The substrate (1 mmol, 0.5 m), NaOAc (10 μmol, 1 mol %) in water, butanedione (0.5 mmol, 0.5 equiv.) and acetic acid (0.2 mmol, 0.2 equiv.) were added to give a final volume of 2 mL in CH3CN. After approximately 5 min, H2O2 (3 equiv., 50 wt % in water) was added. Deviations from this procedure are noted appropriately in the main text.
Reaction progress was determined in situ by Raman spectroscopy at λexc 785 nm primarily through monitoring changes in the intensity of the O−O stretching band of H2O2 at 864 cm−1, the C=O or C−O stretching band of 2‐hydroxy‐1‐phenylethanone at 1692 cm−1 and 1230 cm−1 and the C−O stretching band of 1‐phenyl‐1,2‐ethanediol at 828 cm−1. After 1 h, acetophenone or 1,2‐dichloroethane (0.5 mmol, 0.5 equiv.) was added as internal standard, and an aliquot of the reaction mixture was diluted in CD3CN prior to analysis by 1H NMR spectroscopy (400 MHz). In the case of competition experiments, the same procedure was followed, and the addition sequence of the reagents is noted in the main text.
Raman spectra were recorded by using a PerkinElmer RamanFlex fiber optic coupled spectrometer with samples in 1 cm path length quartz cuvettes. 1H NMR (400 MHz) spectra were recorded on a Bruker Avance spectrometer. Cyclic voltammograms were recorded by using a CHInstruments CHI760 bipotentiostat with a glassy carbon working electrode, an Ag/AgCl reference electrode and a platinum counter electrode. The Bu4NPF6 (0.1 m) added as supporting electrolyte did not interfere with the catalytic activity of the system. UV/Vis absorption spectra were recorded by using a JenaAnalytik Specord 600 spectrophotometer. Raman spectra were recorded at 355 and 632.8 nm by using custom‐built Raman spectrometers. See the Supporting Information for details.
Conflict of interest
The authors declare no conflict of interest.
Supporting information
As a service to our authors and readers, this journal provides supporting information supplied by the authors. Such materials are peer reviewed and may be re‐organized for online delivery, but are not copy‐edited or typeset. Technical support issues arising from supporting information (other than missing files) should be addressed to the authors.
Supplementary
Acknowledgements
Financial support was provided by The Netherlands Ministry of Education, Culture and Science (Gravity Program 024.001.035 to J.B.K. and W.R.B.) and COST association COST action CM1305.
A. Barbieri, J. B. Kasper, F. Mecozzi, O. Lanzalunga, W. R. Browne, ChemSusChem 2019, 12, 3126.
References
- 1. Zhang Z., Song J., Han B., Chem. Rev. 2017, 117, 6834–6880. [DOI] [PubMed] [Google Scholar]
- 2. Zakzeski J., Bruijnincx P. C. A., Jongerius A. L., Weckhuysen B. M., Chem. Rev. 2010, 110, 3552–3599. [DOI] [PubMed] [Google Scholar]
- 3. Chakar F. S., Ragauskas A. J., Ind. Crops Prod. 2004, 20, 131–141. [Google Scholar]
- 4. Ritter S. K., Chem. Eng. News 2008, 86, 15. [Google Scholar]
- 5. Lynd L. R., Cushman J. H., Nichols R. J., Wyman C. E., Science 1991, 251, 1318–1323. [DOI] [PubMed] [Google Scholar]
- 6. Alvira P., Tomás-Pejó E., Ballesteros M., Negro M. J., Bioresour. Technol. 2010, 101, 4851–4861. [DOI] [PubMed] [Google Scholar]
- 7. Mood S. H., Golfeshan A. H., Tabatabaei M., Jouzani G. S., Najafi G. H., Gholami M., Ardjmand M., Renewable Sustainable Energy Rev. 2013, 27, 77–93. [Google Scholar]
- 8. Koppram R., Tomás-Pejó E., Xiros C., Olsson L., Trends Biotechnol. 2014, 32, 46–53. [DOI] [PubMed] [Google Scholar]
- 9. Gamelas J. A. F., Gaspar A. R., Evtuguin D. V., Neto C. P., Appl. Catal. A 2005, 295, 134–141. [Google Scholar]
- 10. Gaspar A. R., Gamelas J. A. F., Evtuguin D. V., Neto C. P., Chem. Eng. Commun. 2009, 196, 801–811. [Google Scholar]
- 11. Evtuguin D. V., Neto C. P., Rocha J., Holzforschung 2000, 54, 381–389. [Google Scholar]
- 12. Fabbri C., Aurisicchio C., Lanzalunga O., Open Chem. 2008, 6, 145–153. [Google Scholar]
- 13. Zhu C., Ding W., Shen T., Tang C., Sun C., Xu S., Chen Y., Wu J., Ying H., ChemSusChem 2015, 8, 1768–1778. [DOI] [PubMed] [Google Scholar]
- 14. Lim S. H., Nahm K., Ra C. S., Cho D. W., Yoon U. C., Latham J. A., Dunaway-Mariano D., Mariano P. S., J. Org. Chem. 2013, 78, 9431–9443. [DOI] [PubMed] [Google Scholar]
- 15. Badamali S. K., Luque R., Clark J. H., Breeden S. W., Catal. Commun. 2011, 12, 993–995. [Google Scholar]
- 16. Baciocchi E., Bietti M., Gerini M. F., Lanzalunga O., Mancinelli S., J. Chem. Soc. Perkin Trans. 2 2001, 1506–1511. [Google Scholar]
- 17. Gellerstedt G., Henriksson G. in Monomers, Polymers and Composites from Renewable Resources (Eds.: M. Belgacem, A. Gandini), Elsevier Science, Amsterdam, 2008, pp. 201–224. [Google Scholar]
- 18. Cui F., Wijesekera T., Dolphin D., Farrell R., Skerker P., J. Biotechnol. 1993, 30, 15–26. [Google Scholar]
- 19. Keserü G. M., Balogh G. T., Bokotey S., Árvai G., Bertók B., Tetrahedron 1999, 55, 4457–4466. [Google Scholar]
- 20. Crestini C., Saladino R., Tagliatesta P., Boschi T., Bioorg. Med. Chem. 1999, 7, 1897–1905. [DOI] [PubMed] [Google Scholar]
- 21. Cui F., Dolphin D., Bioorg. Med. Chem. 1995, 3, 471–477. [DOI] [PubMed] [Google Scholar]
- 22. Drago R. S., Corden B. B., Barnes C. W., J. Am. Chem. Soc. 1986, 108, 2453–2454. [DOI] [PubMed] [Google Scholar]
- 23. Kervinen K., Allmendinger M., Leskelä M., Repo T., Rieger B., Phys. Chem. Chem. Phys. 2003, 5, 4450–4454. [Google Scholar]
- 24. Kervinen K., Korpi H., Mesu J. G., Soulimani F., Repo T., Rieger B., Leskelä M., Weckhuysen B. M., Eur. J. Inorg. Chem. 2005, 2591–2599. [Google Scholar]
- 25. Gaspar A. R., Gamelas J. A. F., Evtuguin D. V., Neto C. P., Green Chem. 2007, 9, 717. [Google Scholar]
- 26. Gaspar A., Evtuguin D. V., Neto C. P., Appl. Catal. A 2003, 239, 157–168. [Google Scholar]
- 27. Kim Y. S., Chang H. M., Kadla J. F., J. Wood Chem. Technol. 2007, 27, 225–241. [Google Scholar]
- 28. Voitl T., von Rohr P. R., ChemSusChem 2008, 1, 763–769. [DOI] [PubMed] [Google Scholar]
- 29. Alves V., Capanema E., Chen C.-L., Gratzl J., J. Mol. Catal. A 2003, 206, 37–51. [Google Scholar]
- 30. Chen C. L., Capanema E. A., Gracz H. S., J. Agric. Food Chem. 2003, 51, 1932–1941. [DOI] [PubMed] [Google Scholar]
- 31. Chen C. L., Capanema E. A., Gracz H. S., J. Agric. Food Chem. 2003, 51, 6223–6232. [DOI] [PubMed] [Google Scholar]
- 32. Cui Y., Chen C.-L., Gratzl J. S., Patt R., J. Mol. Catal. A 1999, 144, 411–417. [Google Scholar]
- 33. Saisaha P., de Boer J. W., Browne W. R., Chem. Soc. Rev. 2013, 42, 2059–2074. [DOI] [PubMed] [Google Scholar]
- 34. Dong J. J., Unjaroen D., Mecozzi F., Harvey E. C., Saisaha P., Pijper D., de Boer J. W., Alsters P., Feringa B. L., Browne W. R., ChemSusChem 2013, 6, 1774–1778. [DOI] [PubMed] [Google Scholar]
- 35. Pijper D., Saisaha P., de Boer J. W., Hoen R., Smit C., Meetsma A., Hage R., van Summeren R. P., Alsters P. L., Feringa B. L., Dalton Trans. 2010, 39, 10375–10381. [DOI] [PubMed] [Google Scholar]
- 36. Saisaha P., Pijper D., van Summeren R. P., Hoen R., Smit C., de Boer J. W., Hage R., Alsters P. L., Feringa B. L., Browne W. R., Org. Biomol. Chem. 2010, 8, 4444. [DOI] [PubMed] [Google Scholar]
- 37. Dong J. J., Saisaha P., Meinds T. G., Alsters P. L., Ijpeij E. G., van Summeren R. P., Mao B., Fañanás-Mastral M., de Boer J. W., Hage R., Feringa B. L., Browne W. R., ACS Catal. 2012, 2, 1087–1096. [Google Scholar]
- 38. Saisaha P., Dong J. J., Meinds T. G., de Boer J. W., Hage R., Mecozzi F., Kasper J. B., Browne W. R., ACS Catal. 2016, 6, 3486–3495. [Google Scholar]
- 39. Mecozzi F., Dong J. J., Saisaha P., Browne W. R., Eur. J. Org. Chem. 2017, 6919–6925. [DOI] [PMC free article] [PubMed] [Google Scholar]
- 40. Pierpont C. G., Lange C. W., Prog. Inorg. Chem. 1994, 41, 331–442. [Google Scholar]
- 41. Xu Z., Sci. Rep. 2013, 3, 2914. [DOI] [PMC free article] [PubMed] [Google Scholar]
- 42. Makhlynets O. V., Das P., Taktak S., Flook M., Mas-Balleste R., Rybak-Akimova E. V., Que L., Chem. Eur. J. 2009, 15, 13171–13180. [DOI] [PubMed] [Google Scholar]
- 43. Oh N. Y., Seo M. S., Lim M. H., Consugar M. B., Park M. J., Rohde J.-U., Han J., Kim K. M., Kim J., L. Que, Jr. , Nam W., Chem. Commun. 2005, 5644. [DOI] [PubMed] [Google Scholar]
- 44. Jensen M. P., Lange S. J., Mehn M. P., Que E. L., Que L., J. Am. Chem. Soc. 2003, 125, 2113–2128. [DOI] [PubMed] [Google Scholar]
- 45. Ruiz R., Caneschi A., Gatteschi D., Sangregorio C., Sorace L., Vázquez M., Inorg. Chem. Commun. 2000, 3, 76–79. [Google Scholar]
- 46. Sheriff T. S., Carr P., Piggott B., Inorg. Chim. Acta 2003, 348, 115–122. [Google Scholar]
- 47. Sheriff T. S., Carr P., Coles S. J., Hursthouse M. B., Lesin J., Light M. E., Inorg. Chim. Acta 2004, 357, 2494–2502. [Google Scholar]
- 48. Attia A. S., Pierpont C. G., Inorg. Chem. 1997, 36, 6184–6187. [Google Scholar]
- 49. Hartman J. R., Foxman B. M., Cooper S. R., Inorg. Chem. 1984, 23, 1381–1387. [Google Scholar]
- 50. Lynch M. W., Hendrickson D. N., Fitzgerald B. J., Pierpont C. G., J. Am. Chem. Soc. 1984, 106, 2041–2049. [Google Scholar]
- 51. Panja A., Jana N. C., Adak S., Pramanik K., Inorg. Chim. Acta 2017, 459, 113–123. [Google Scholar]
- 52. Beck S. M., Brus L. E., J. Am. Chem. Soc. 1982, 104, 4789–4792. [Google Scholar]
- 53. Joulié L. F., Schatz E., Ward M. D., Weber F., Yellowlees L. J., J. Chem. Soc. Trans. 1994, 799–804. [Google Scholar]
- 54. Fraile J. M., García J. I., Hormigón Z., Mayoral J. A., Saavedra C. J., Salvatella L., ACS Sustainable Chem. Eng. 2018, 6, 1837–1847. [Google Scholar]
- 55. Reingold J. A., Son S. U., Kim S. B., Dullaghan C. A., Oh M., Frake P. C., Carpenter G. B., Sweigart D. A., Dalton Trans. 2006, 2385–2398. [DOI] [PubMed] [Google Scholar]
- 56. Oh M., Carpenter G. B., Sweigart D. A., Organometallics 2002, 21, 1290–1295. [Google Scholar]
- 57. Nichols J. M., Bishop L. M., Bergman R. G., Ellman J. A., J. Am. Chem. Soc. 2010, 132, 12554–12555. [DOI] [PMC free article] [PubMed] [Google Scholar]
Associated Data
This section collects any data citations, data availability statements, or supplementary materials included in this article.
Supplementary Materials
As a service to our authors and readers, this journal provides supporting information supplied by the authors. Such materials are peer reviewed and may be re‐organized for online delivery, but are not copy‐edited or typeset. Technical support issues arising from supporting information (other than missing files) should be addressed to the authors.
Supplementary