
Figure 3.
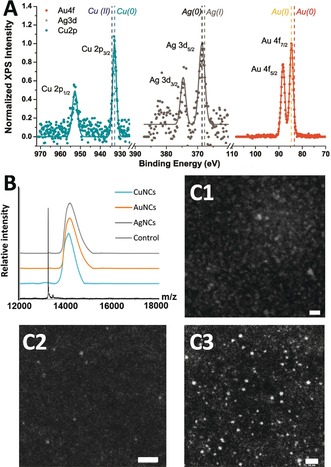
Characterization of Protein‐NCs complexes. A) XPS spectra of WHW‐CuNCs (left), WHW‐AgNCs (center), and WHW‐AuNCs (right). B. MALDI‐TOF mass spectra of WHW control protein (black) WHW‐CuNCs (cyan), WHW‐AuNCs (orange), and WHW‐AgNCs (gray). C) HAADF STEM images of the WHW‐CuNCs (C1), WHW‐AuNCs (C2), and WHW‐AgNCs (C3). Scale bar: 10 nm.