Figure 1.

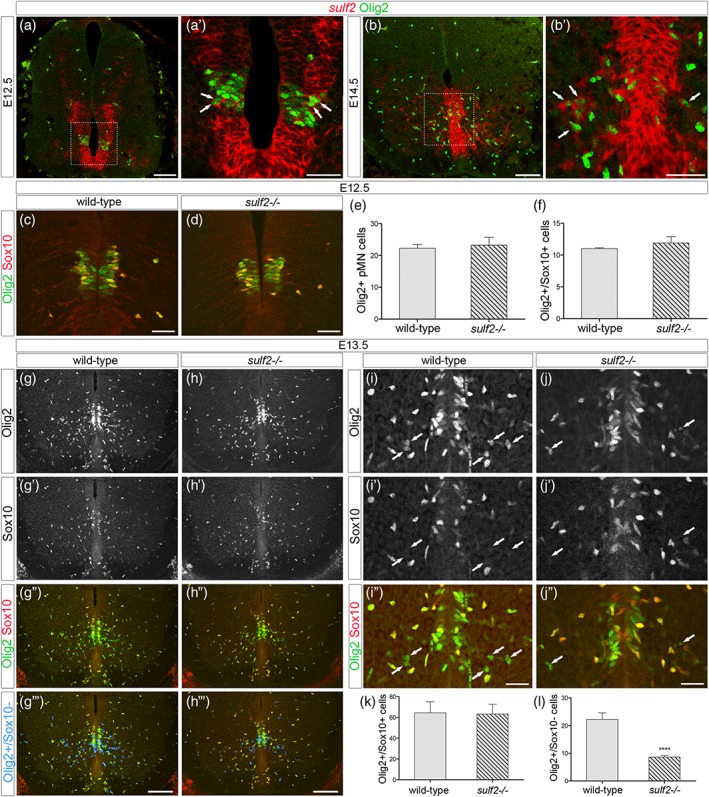
Sulf2 depletion impairs production of Olig2‐expressing precursor cells distinct from OPCs. All images show transverse spinal cord sections. (a–b′) Combined detection of sulf2 mRNA (red) and Olig2 (green) at E12.5 (a, a′) and E14.5 (b, b′). a′ and b′ show higher magnification of the areas framed in a and b, respectively. Arrows in a′ and b′ point to sulf2+/Olig2+ cells. (c, d, g–j″) Double detection of Olig2 (green) and Sox10 (red) at E12.5 (c, d) and E13.5 (g–j″) in wild‐type (c, g–g‴, i–i″) and sulf2−/− (d, h–h‴, j–j″) embryos. In g‴ and h‴, Olig2+/Sox10_ cells (green only) have been highlighted in blue using Colocalization Finder feature of ImageJ software. Arrows in i–j″ point to Olig2+/Sox10‐ cells. Note reduced number of Olig2+/Sox10_ cells in the spinal parenchyma of sulf2−/− (h″, h″’, j″) compared to wild‐type (g″, g‴, i″) E13.5 embryos. (e–f) Quantification of Olig2+ pMN cells (e, n = 4) and Olig2+/Sox10+ cells (f, n = 4) in E12.5 wild‐type and sulf2−/− embryos. (k, l) Quantification of Olig2+/Sox10+ cells (k) and Olig2+/Sox10_ cells (l) in the E13.5 spinal parenchyma of wild‐type (n = 6) and sulf2−/− (n = 8) embryos. Data are presented as mean ± SEM (****p < .0001). Scale bars = 100 μm in a, b, g–h‴ and 50 μm in a′, b′, c, d, i–j″ [Color figure can be viewed at wileyonlinelibrary.com]
