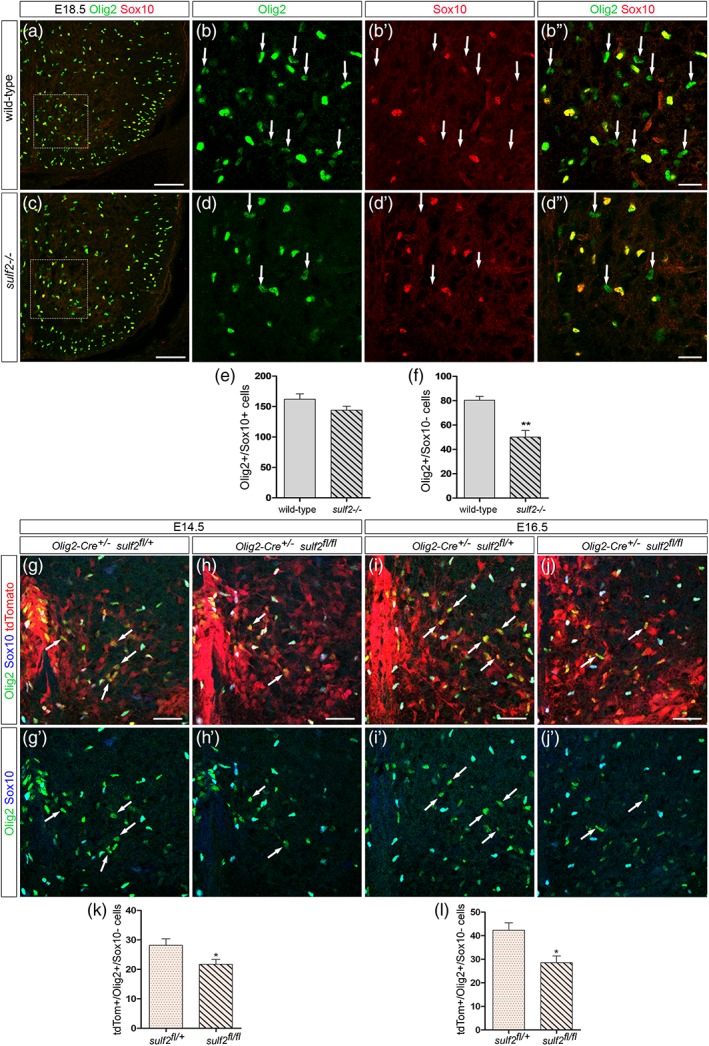
Figure 2.

Deficient production of Olig2+/Sox10_ cells is detectable at late embryonic stage and in CreLox model deleting sulf2 specifically in Olig2+ neural progenitors All images show transverse sections of hemi‐ventral spinal cord. (a–d″) Double detection of Olig2 (green) and Sox10 (red) at E18.5 in wild‐type (a, b–b″) and sulf2−/− (c, d–d″) embryos. b–b″ and d–d″ show higher magnification of the areas framed in a and c, respectively. Arrows in b–b″ and d–d″ point to Olig2+/Sox10_ cells. (E–F) Quantification of Olig2+/Sox10+ cells (e) and Olig2+/Sox10_ cells (f) in the E18.5 spinal parenchyma of wild‐type (n = 5) and sulf2−/− (n = 5) embryos. (g–j′) Detection of Olig2 (green), Sox10 (blue) and tdTomato (red) at E14.5 (g, h) and E16.5 (i, j) in Olig2‐Cre +/− /sulf2 fl/+ (g, i) and Olig2‐cre +/− ;sulf2 fl/fl (h, j) embryos. g′–j′ show double staining of Olig2 and Sox10 corresponding to g–j. Note high level of tdTomato expression reflecting efficient recombinase activity of the Cre protein in the ventral spinal cord. (k, l) Quantification of Olig2+/Sox10_ cells in the spinal parenchyma of Olig2‐Cre +/− /sulf2 fl/+ and Olig2‐cre +/− ; sulf2 fl/fl embryos at E14.5 (k, n = 5 for each genotype) and at E16.5 (l, n = 5 for each genotype). Data are presented as mean ± SEM (**p < .01, *p < .05). Scale bars = 100 μm in a, c and g–j′ and 25 μm in b–b″, d–d″ [Color figure can be viewed at wileyonlinelibrary.com]
