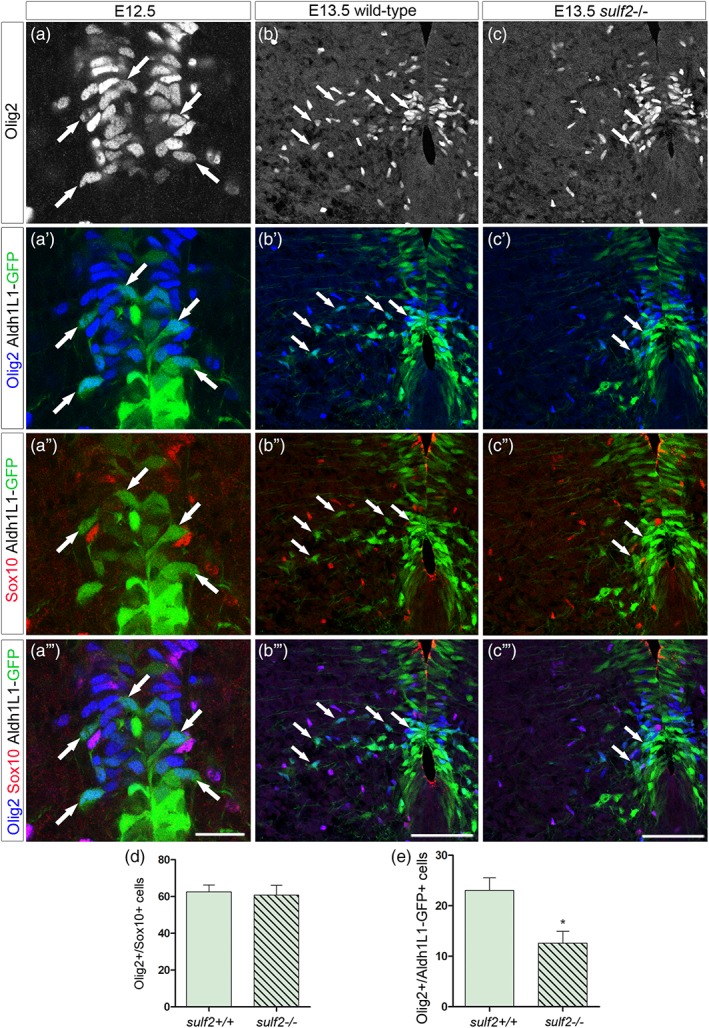
Figure 4.

Sulf2 depletion impairs production of Aldh1L1‐GFP+/Olig2+ cells originating from the pMN domain. All images show transverse spinal cord sections. (a–c‴) Combined detection of Olig2 (blue), Sox10 (red), and GFP (green) on Aldh1L1‐GFP transgenic embryos on a sulf2 wild‐type background at E12.5 (a–a‴) and E13.5 (b–b″’) and on sulf2‐/‐ background at E13.5 (c–c‴). Vertical sets present successively Olig2 staining, Olig2 and Aldh1L1‐GFP staining, Sox10 and Aldh1L1‐GFP staining and the merged image. Arrows in all panels point to Olig2+/Sox10‐ cells. a–a‴ show high magnification of the ventral progenitor zone. Note the presence of GFP+/Olig2+/Sox10_ cells both in the progenitor zone (Olig2+ pMN domain) and in the adjacent spinal parenchyma. (d) Quantification of Olig2+/Sox10+ cells in E13.5 wild‐type and sulf2−/− embryos (n = 5 for each genotype). (e) Quantification of Aldh1L1‐GFP+/Olig2+/Sox10_ cells in E13.5 wild‐type and sulf2−/− embryos (n = 5 for each genotype). Data are presented as mean ± SEM (*p < .05). Scale bars = 25 μm in a–a‴ and 75 μm in b–c‴ [Color figure can be viewed at wileyonlinelibrary.com]
