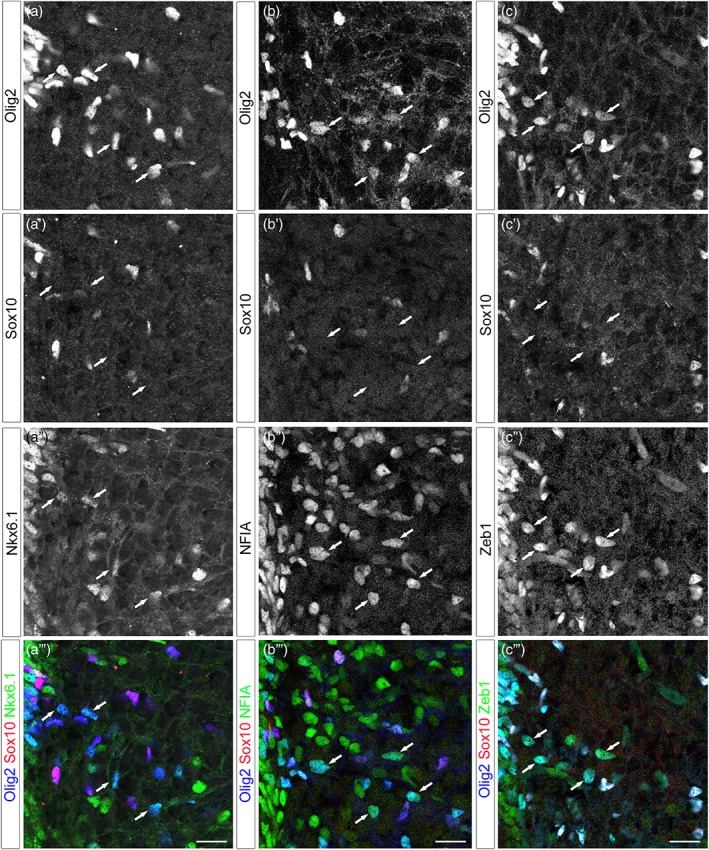
Figure 5.

Olig2+/Sox10_ cells coexpress a set of AP nuclear proteins as they populate the ventral spinal parenchyma. All images show transverse sections of hemi‐ventral spinal cord, ventral progenitor zone is on the upper left. (a–c‴) Combined detection of Olig2 (blue), Sox10 (red), and Nkx6.1 (a″–a‴, green), NFIA (b″–b′″, green) or Zeb1 (c″–c‴, green) at E14.5. Vertical sets present successively Olig2 staining, Sox10 staining followed by astrocytic marker staining and the corresponding merged image. Arrows point to Olig2+/Sox10_ cells positive for the astrocytic markers. Scale bars = 50 μm [Color figure can be viewed at wileyonlinelibrary.com]
