Figure 6.

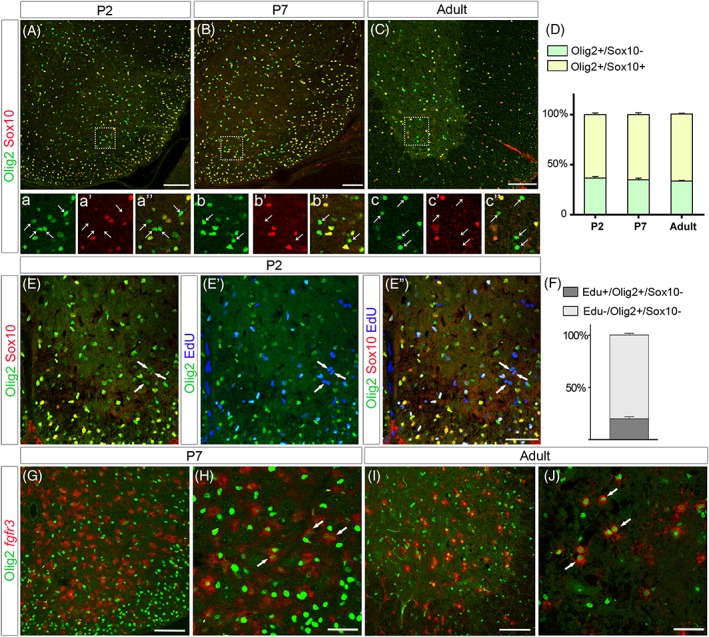
Olig2+/Sox10_ cells are maintained at postnatal and at adult stages
All images show transverse sections of hemi‐ventral spinal cord. (A–c″) Double detection of Olig2 (green) and Sox10 (red) at P2 (A, a–a″), P7 (B, b–b″), and adult (C, c–c″) stages. Images a–a″, b–b″, and c–c″ show higher magnification of the areas framed in A, B, and C, respectively and horizontal sets present successively Olig2 staining, Sox10 staining and the merged image. Note the presence of Olig2+/Sox10_ cells (arrows) at all stages. (D) Proportion of Sox10_ and Sox10+ cells on the Olig2+ cell population in the ventral spinal cord at P2 (n = 5), P7 (n = 5) and at adult stage (n = 5). (E–E″) Combined detection of Olig2 (green), Sox10 (red) and EdU (blue) at P2. Images E, E′, and E″ show successively Olig2/Sox10 staining, Olig2/EdU staining, and the merged image. Arrows point to Olig2+/Sox10_ cells positive for EdU. (F) Proportion of EdU+ cells on the Olig2+/Sox10‐ cell population at P2 (n = 4). (G–J) Double detection of Olig2 (green) and fgfr3 mRNA (red) viewed on ventral spinal cord hemi‐section at P7 (G, H) and at adult stage (I, J). H and J are high magnifications of the ventral spinal cord in which arrows point to Olig2+/fgfr3+ cells. Data are presented as mean ± SEM. Scale bars = 100 μm in A–E″, G, I and 50 μm in H and J [Color figure can be viewed at wileyonlinelibrary.com]
