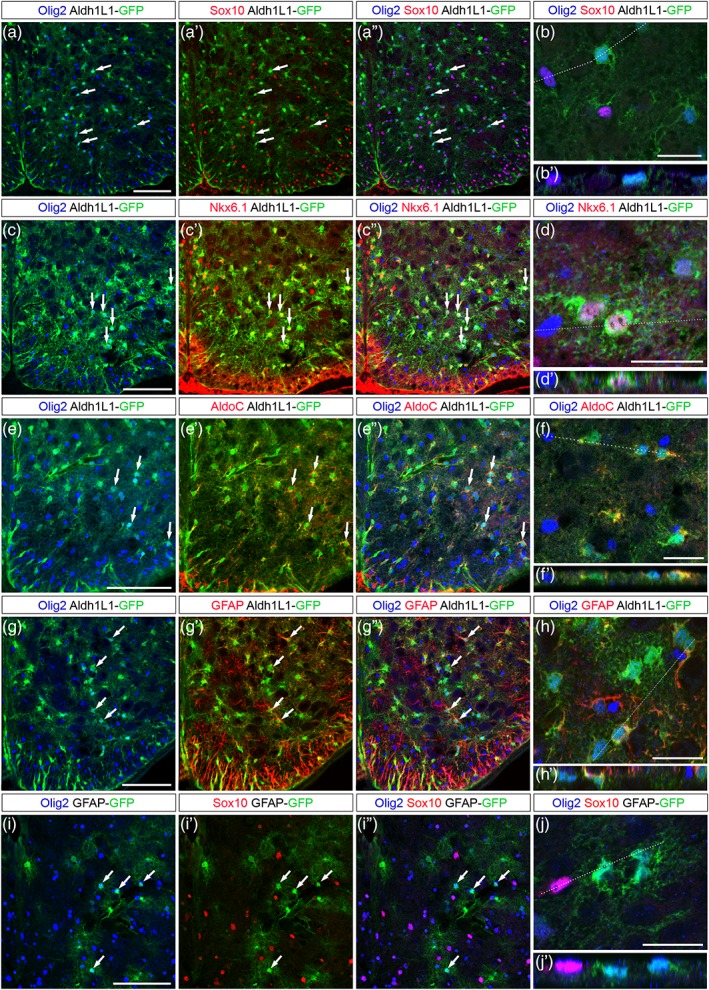
Figure 7.

Olig2+ APs retain expression of Olig2 as they differentiate in the P7 ventral spinal cord. Images show transverse sections of P7 hemi‐ventral spinal cord. (a–j′) Combined detection of Olig2 (blue), Sox10 (a′–b′, i′–j′, red), Nkx6.1 (c′–d′, red), AldoC (e′–f′, red) or GFAP (g′–h′, red) in Aldh1L1‐GFP (a–h′, green) and GFAP‐GFP (i–j′, green) transgenic individuals. Horizontal sets present successively Olig2 and GFP staining, Sox10, Nkx6.1, AldoC or GFAP and GFP staining (prime) and the merged image (double prime). Arrows point to Olig2+ cells positive for the astrocytic markers. Panels b, d, f, h and j show higher magnification of the ventral grey matter and underneath prime panels show images in the Z‐plane, corresponding to the dashed line drawn in the X/Y plane above. Scale bars = 100 μm in a–a′, c–c′, e–e′, g–g′, and i–i′ and 25 μm in b, d, f, h, and j [Color figure can be viewed at wileyonlinelibrary.com]
