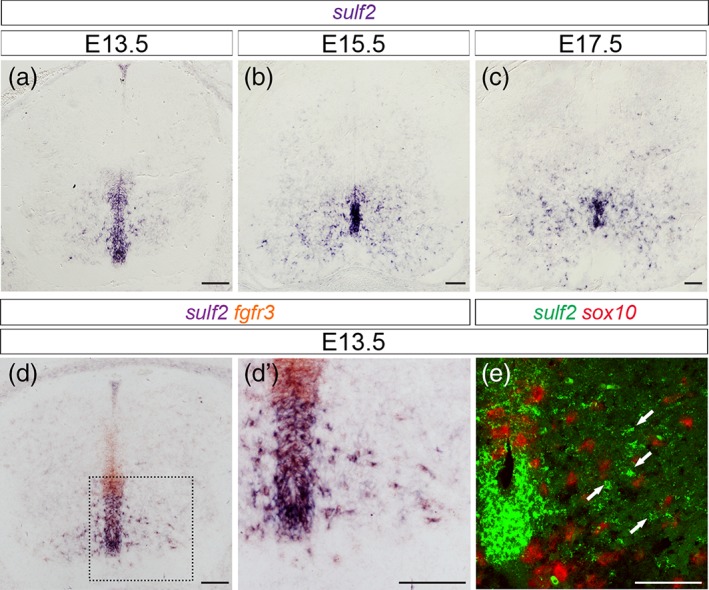
Figure 9.

Sulf2 is broadly expressed in ventral APs as they populate the spinal parenchyma. All images show transverse spinal cord sections. (a–c) Temporal expression profile of sulf2 mRNA at E13.5 (a), E15.5 (b), and E17.5 (c). (d, d′) Combined detection of sulf2 (brown) and fgfr3 (purple) mRNAs. d′ shows higher magnification of the area framed in d. (e) Combined detection at confocal resolution of sulf2 (green) and sox10 (red) mRNAs in hemi‐ventral spinal cord at E13.5. Scale bars = 100 μm [Color figure can be viewed at wileyonlinelibrary.com]
