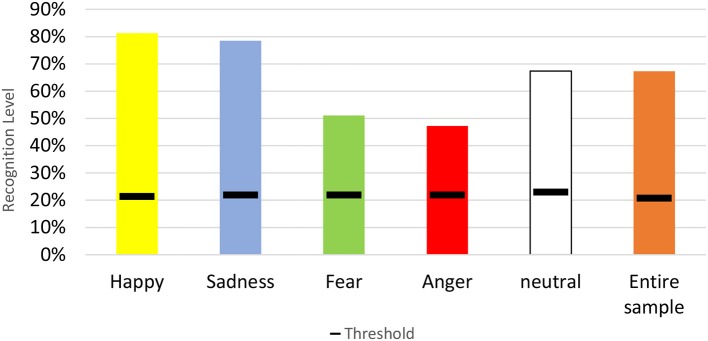
Figure 2.
This graph shows the percent correct recognitions of the expected emotion from Laban clips with the threshold for random recognition level. Each emotion is represented by a different color: Yellow for happiness, blue for sadness, green for fear, red for anger and white for the neutral emotion. The entire sample is marked orange.

