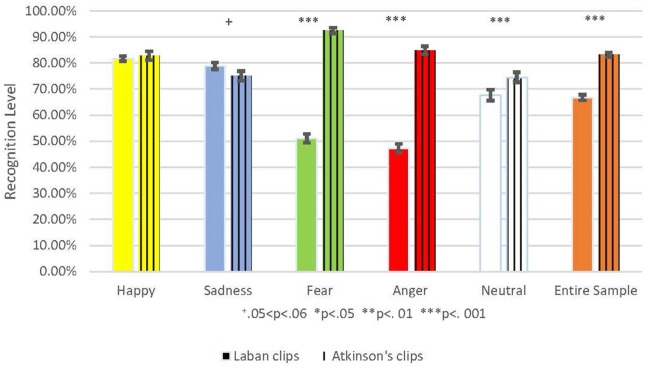
Figure 4.
This shows the Comparison between the percent of correct emotion recognition from the Laban stimuli to those from Atkinson's validated clips. The Laban recognition level is colored with a full color, and Atkinsons' validated clips are marked with vertical lines. Each emotion is represented by a different color: Yellow for happiness, blue for sadness, green for fear, red for anger, and white for the neutral emotion. The entire sample is marked orange. Accuracy mean is represented by the bar's height and standard deviation by the black brackets. The significance level is marked: +0.05 < p < 0.06, *p < 0.05, **p < 0.01, ***p < 0.001.

