
Figure 4.
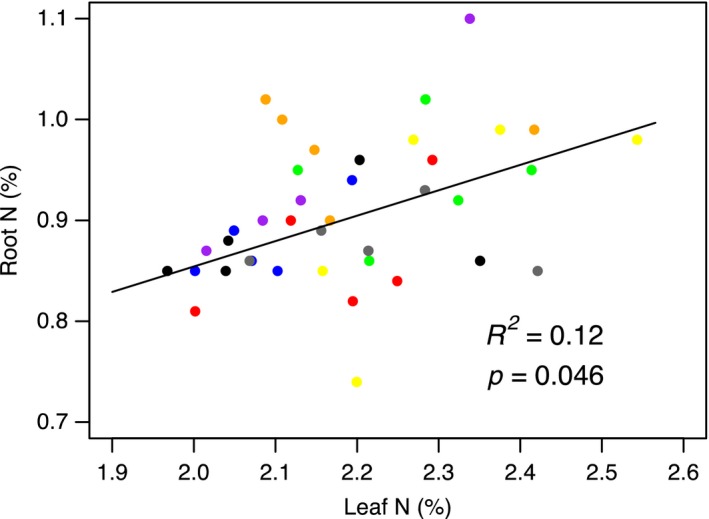
Relationship between community‐weighted mean shoot N and root N from the 40 mixed community plots. Treatments are shown as black = control, red = grasses, blue = forbs, green = legumes, purple = grasses + forbs, orange = grasses + legumes, yellow = forbs + legumes, grey = grasses + forbs + legumes. Full regression matrix of shoot traits and root trait relationships is shown in Table S9 [Colour figure can be viewed at wileyonlinelibrary.com]