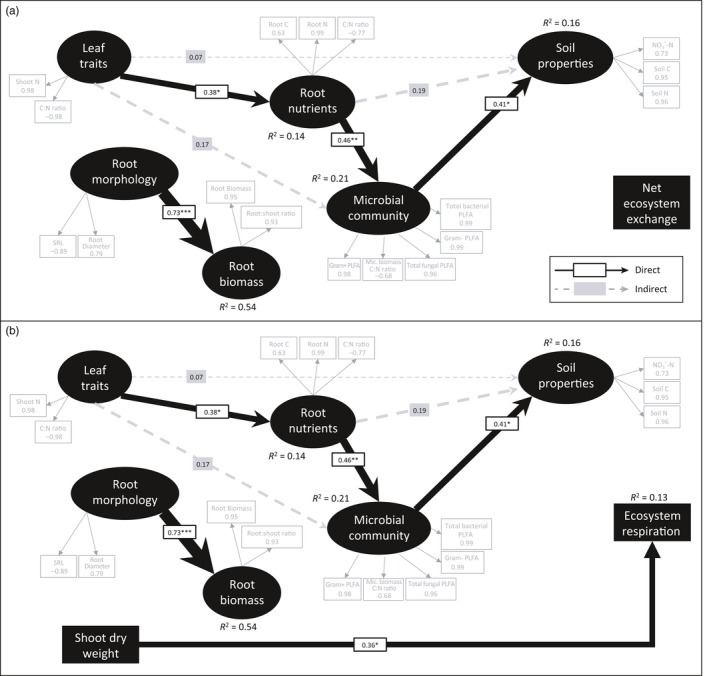
Figure 7.

Partial least‐squares path models showing the relationships between leaf and root traits, soil properties, microbial community attributes, above‐ground biomass and (a) net ecosystem exchange (GoF index 0.4623) and (b) ecosystem respiration (GoF index 0.4383) in mixed grassland communities. Reflective LVs (black ovals) are indicated by measured variables (grey boxes) with their respective loadings shown. The width of the arrows indicates the strength of the causal relationships supplemented by standardized path coefficients (*p < 0.05; **p < 0.01; ***p < 0.001). R 2 values indicate the explained variance of response variables. To meet the requirements of unidimensionality, the indicator variables in (a) shoot C:N, root C:N and microbial C:N and in (b) shoot C:N, root C, microbial C:N and total bacterial PLFA were multiplied by negative one. See Methods S1 for details on model selection procedure
