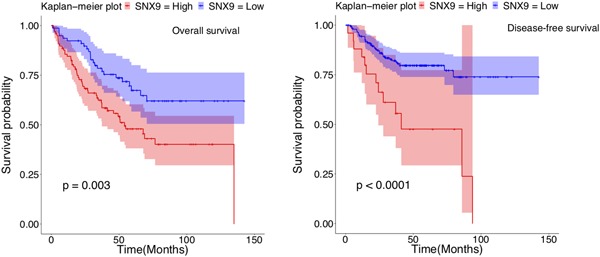
Figure 5.

Survival analysis with SNX9 expression profiles in human colorectal cancers. The Kaplan–Meier plot with SNX9 expression profiles in GSE17536 and GSE14333 datasets using endpoint overall survival status (left) and endpoint disease‐free survival status (right). Shading along the curve showed 95% confidential interval. In human colorectal cancers, the high expression of SNX9 was correlated to poor prognosis for overall survival (high: n = 99; low: n = 78) and disease‐free survival (high: n = 25; low: n = 201). SNX9: sorting nexin 9 [Color figure can be viewed at wileyonlinelibrary.com]
